I’m struggling to use the sunburst graph object in a Jupyter notebook. It’s perfect for my use case (spread of file formats in a given corpus), however using the parameter branchvalues=‘total’ gives me just a white box.
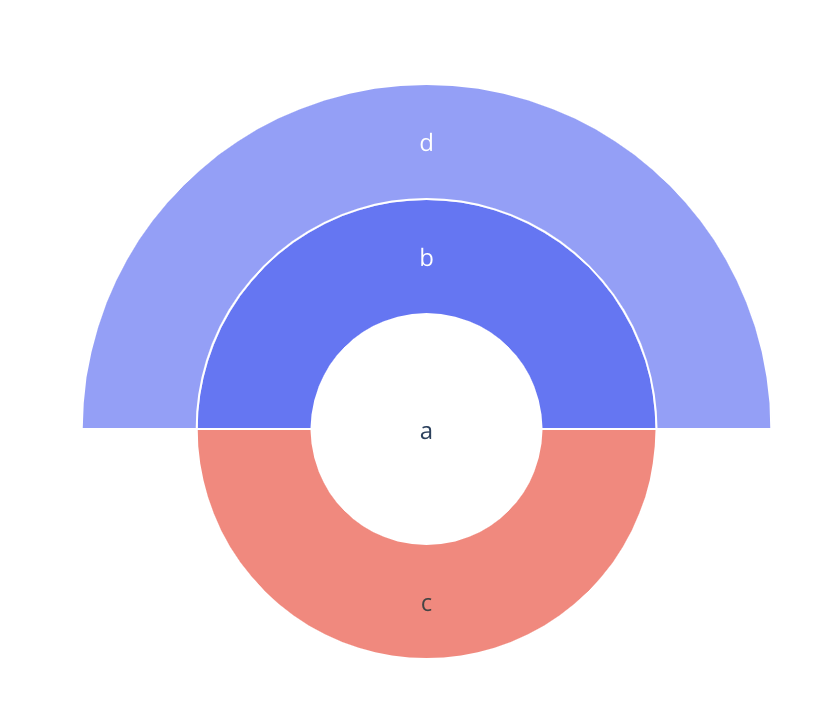
A dodgy workaround setting the parent values to 0 gives me this:
The idea behind branchvalues is that for a sunburst like the one above, you either externally calculate the values for every sector and use total OR you specify the value of all leaves and set the branch values to 0 and use remainder.
The more interesting case is if you ever have a parent whose width is not fully accounted for by its children. In this case you either specify the total value of the parent or the “remainder” value of the parent i.e. the additional width of the parent, over and above that of the children.
Unfortunately I was never able to rectify it, I checked repeatedly the values of parents and children and could not work out where the issue was. My values are integers, so using floats is probably not your issue.
For the above plot, the values for each parent were calculated externally and the children values added to the total of each parent, hence my confusion. Setting branch values to 0 is a poor solution as I’d like to know the totals for branch and leaf values.
Ah I see. I would love to see an example of this with numbers so I can track it down! It definitely seems like a bug with total mode.
For remainder mode, when you say you want to “know” the values, do you mean when you hover over the sectors? This is possible via hovertemplate I believe, if not in 1.49.x, in the 1.50.x version of plotly.js which was just released, and should be available in the soon-to-come plotly.py 4.2
I’d share the data with you, but I removed the figure as I just couldn’t get it to work! Their is potentially something I’m missing, but I can’t see it. If I have a chance I’ll try and recreate it, as it is a very neat way of visualising these sort of stats.
Yes the hover worked, but if I have to set branch values to , then of course this is not an accurate figure.
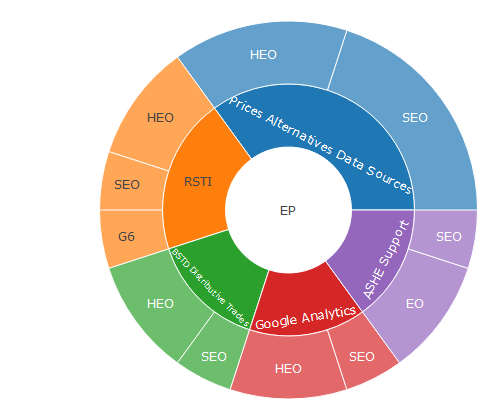
Pic 1 is what the sunburst looks like, pic 2 is how I would like it to look.
This is the data that I’m using, I’ve manually added up all the values and they add up exactly to the value of their parent. I’ve also tried the workaround mentioned above by setting the root value to zero.
I don’t understand why the visualization will only work with branchvalues = remainder.
I have made a smaller dummy data to test to plot a sunburst with branchvalues=total (the 2nd picture) and that works fine
Have you found a solution to this problem? I am having a similar issue. I want the wedges to be evenly distributed with respect to the size of the parent. When using branchvalues=‘total’ on a small test dataset this works perfectly. But when I use large dataset I get a blank plot.
No I haven’t unfortunately! at least I know it’s not just me. Mine also worked on a smaller dataset, I don’t understand the issue as mine isn’t a particularly large plot it only has two layers.
By any chance did you also have repetitive labels on any of the layers?
Could you be more specific as to exactly what you would like to see? I’ve already shared the data I’m using, any attempt to plot a bare simple sunburst it with branchvalues =totals fails
I believe all ids are unique? the above data is created within an R script that pulls data from different sources, I will save it to excel and try to share it on here
I have loads of duplicate labels throughout the layers and I use the ids array to overcome that. I actually figured out a work around for my particular problem. I use remainder instead of total and set the weights in the values array. I wanted the wedges to be symmetrical on all layers and for the wedges to take up the entire circle. However, because my data set is very large (about 18,000 nodes) there was a lot of math, graph theory and headaches involved in my solution.
Apologies, so I slightly edited the data as some of is sensitive. In that case there’s two projects that share the same first name. E.g. BSTD project1 BSTD project2
I’ve re-run the original script without any duplicates, still having the same issue.