I love music and data so, needless to say, I had so much fun exploring my Spotify listening data with Plotly Studio!
![]()
![]()
![]()
Checkout the app here: https://spotify-listening-analytics.plotly.app/ deployed to Plotly Cloud.
Data Generation
I used the Spotify API to pull data on my listening habits to compare the top 100 songs played over the past 4 weeks (short term), 6 months (medium term), and year (long term). If you’re interested in pulling your data, you can use this python script that pulls from the Spotify API and writes to a csv file.
Plotly Studio Prompting
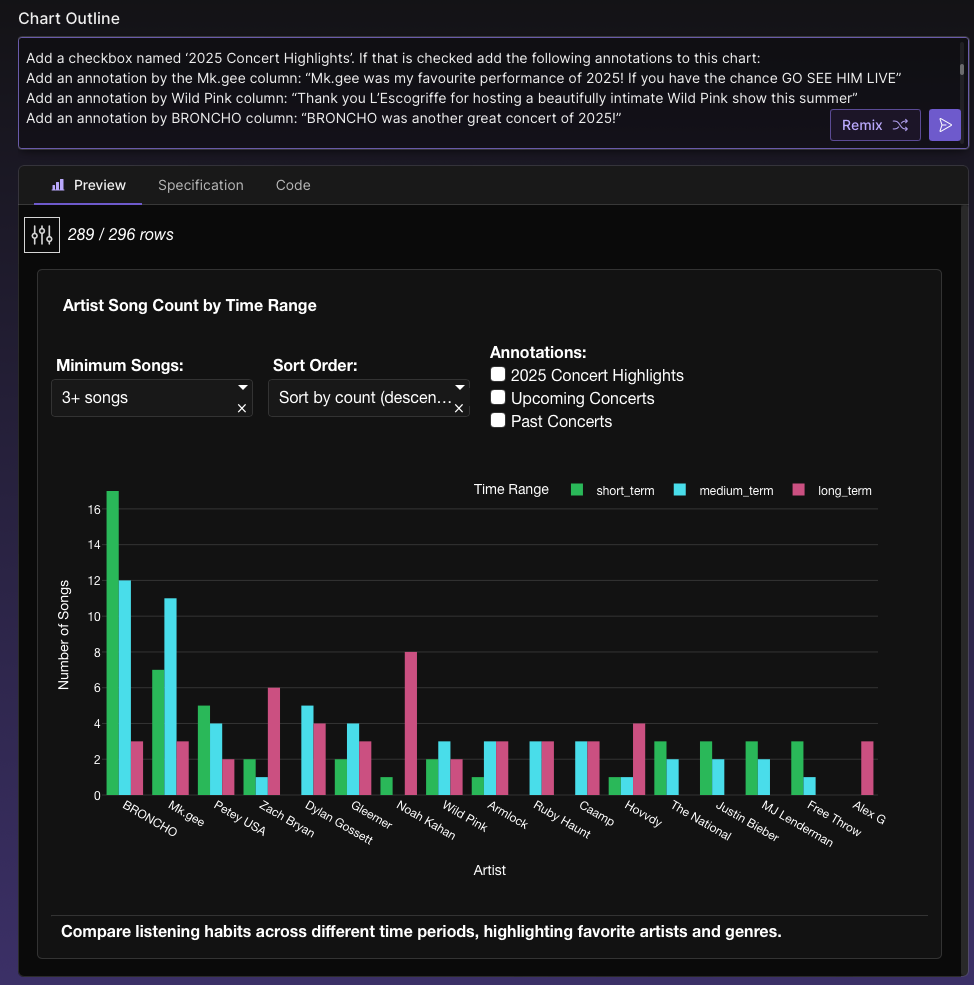
From there, it’s super easy to drag and drop the csv file into Plotly Studio and then write a quick description of what I want to explore in the data: “Analyze top 100 songs across three different time ranges (short, medium, and long term) to understand listening patterns, artist preferences, and genre distribution.“
In addition to the generated charts, I added a few prompts of my own to explore parts of the data that I wasn’t very familiar with, like the Spotify popularity score:

I also edited the prompts to add more features to some of the charts, like annotations. Even though I highly appreciate interacting with annotated charts, this is a step that I sometimes skip when building apps because it can be a bit time consuming to programatically add, position, and edit annotations. With the natural language prompt, it couldn’t have been easier! Thus, I may have gone a bit overboard! I decided to make the annotations selectable (i.e. hidden by default) to avoid too much text overwhelming the graph display.
Style & Theme
This was one of my favourite parts of the app generation! The theme generated was fittingly Spotify-inspired. There was a bit too much green for my taste, but it was super easy to update the colourway to add some pink! This also helped make some of the graphs a bit more distinguishable. I updated the colours directly in the code section, but you could also update the Theme Outline text to make changes.

The App
https://spotify-listening-analytics.plotly.app/
Plotly Studio made this data exploration so easy, and I arguably had too much fun re-listening to all of my most-played songs while making this app. ![]()
![]()
![]() I highly recommend putting on your favourite playlist while taking Studio for a spin!
I highly recommend putting on your favourite playlist while taking Studio for a spin!