It’s unclear to me what approach you are trying to implement. Is it a list of Marker components or a GeoJSON components? How many markers do you have? Could you make a small MWE (that runs) illustrating where you are right now?
Not sure if I can actually setup a MWE right now :-s.
I’ll try text based again.
Data is in a database.
The app queries data to populate a dash datatable, but also markers on a map.
row_id of the dashtable correspond to marker ids on the map.
Markers are in an overlay, as list of markers, as the number of markers is rather low (<100).
The goal would be to click a cell on the datatable and that that marker changes color and preferably that the popup opens.
In this way you can “select” (read click) on the table, and see the geographical information on the map.
The principal would be to use a callback with the MATCH pattern (activecell → row_id) must match id of the marker.
Output -. icon change.
However this can’t be done, as the row_id is stuck in a dict, and can’t be matched directly on the id of the marker.
I’ll try to setup a MWE, but that doesn’t seem to be easy.
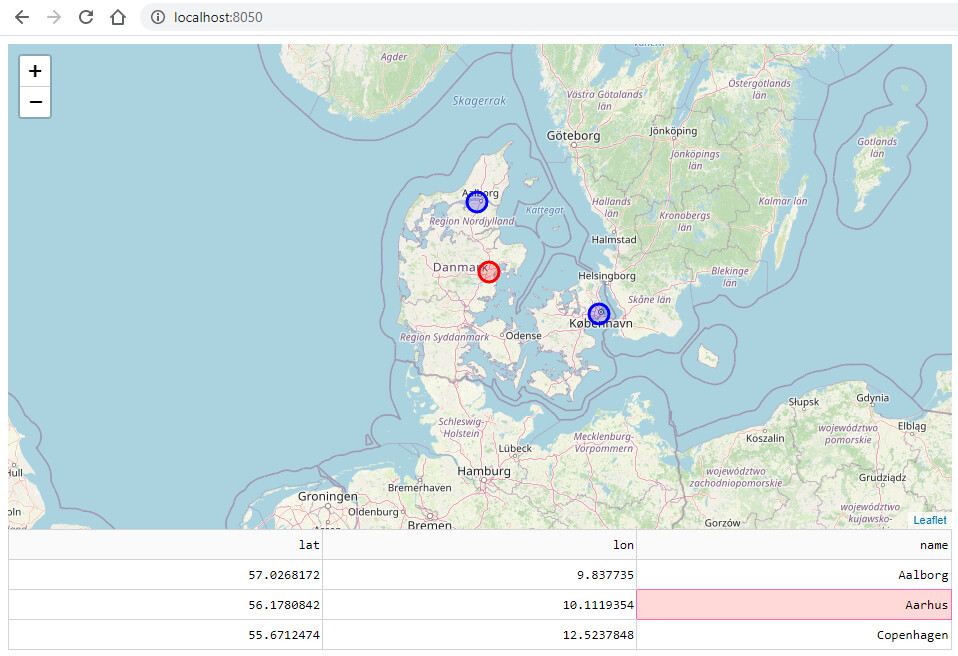
Here is a complete example with a map and table, where the markers on the map change color if the corresponding row is selected in the table,
import dash_leaflet as dl
import dash_leaflet.express as dlx
from dash import Dash, html, dash_table, Output, Input
from dash_extensions.javascript import assign

# A few cities in Denmark.
cities = [dict(name="Aalborg", lat=57.0268172, lon=9.837735),
          dict(name="Aarhus", lat=56.1780842, lon=10.1119354),
          dict(name="Copenhagen", lat=55.6712474, lon=12.5237848)]
# Generate geojson with a marker for each city and name as tooltip.
geojson = dlx.dicts_to_geojson([{**c, **dict(tooltip=c['name'])} for c in cities])
# Create a javascript function that renders selected markers in red, the others in blue.
point_to_layer = assign("""function(feature, latlng, context){
    // Figure out if the marker is selected.
    const selected = context.props.hideout.includes(feature.properties.name);
    // Render selected markers in red.
    if(selected){return L.circleMarker(latlng, {color: 'red'});}
    // Render non-selected markers in blue.
    return L.circleMarker(latlng, {color: 'blue'});
}""")
# Create example app.
app = Dash(prevent_initial_callbacks=True)
app.layout = html.Div([
    dl.Map(children=[
        dl.TileLayer(),
        dl.GeoJSON(data=geojson, options=dict(pointToLayer=point_to_layer), hideout=[], id="geojson"),
    ], style={'width': '50%', 'height': '50vh'}, id="map"),
    dash_table.DataTable(
        columns=[{"name": i, "id": i} for i in sorted(list(cities[0].keys()))],
        data=cities, id="table", style_table={'width': '50%', 'height': '50vh'}
    )
])


@app.callback(Output("geojson", "hideout"), Input("table", "selected_cells"))
def update_map(selected_rows):
    selected_cities = [cities[item['row']] for item in selected_rows]
    return [city['name'] for city in selected_cities]


if __name__ == '__main__':
    app.run_server()
I believe this is what you are asking? ![]()
![]()
Look super nice! Thanks a lot for the effort and explanations!
I am trying to include GeoTIFFOverlay in the dl.Map.
I works well with the example proposed here:
First, if I understand correctly, GeoTIFFOverlay could not be part of LayersControl and to be checked/unchecked?
I also tried to use my own COGs, which I made with GDAL - but it seems that dl.GeoTIFFOverlay do not reads it as COGs, but as normal TIFF - what could be the reason?
I also checked the possibility to render it differently - like for exampe wind speed/direction which is included in leaflet-geotiff plugin:
Any support on being able to use COGs in dash-leaflet and how to be able to use Leaflet plugins in dash-leaflet will be highly appreciated.
Yes, the GeoTIFF component was intended for not-too-large raster data in tiff format. For large COGs, I would recommend serving the data using a separate tile server, e.g. Terracotta. Here is a small example,
Thanks a lot Emil, I read abot this solution (terracota) before from your previous replies and was about to apply it.
May I just ask you to respond on my biggest concern - about using external Leaflet plugins - such as the one I mentioned in my post - leaflet-geotiff-vector-arrows.js, but there are many, many others useful to build multifunctional and customizable map.
If I understand correctly, it is not enough to have the .js file in the asset dir and call the js object from it, like here:
In fact this object L.LeafletGeotiff.vectorArrows or any other defined in specific js plugin, first should be converted to Python Classes, as suggested here:
and just after that it could be used in dash-leaflet?
I am developing a free Geography App for high schools with huge amount of different types of data and would like the students to be able to create their own maps, to draw on them, add labels, change styles of the drawn features etc. and that is why I will need external js scripts to add some more functionalities and map customizations.
You might be able to develop dash-leaflet plugins as custom Dash components, but to be honest, I am not sure it will work. I have got errors reported previously from people trying to do it, but I haven’t attempted myself.
I would suggest the following workflow for developing (converting) plugins,
- Fork the
dash-leafletmain repo, create a new branch, and develop the component here - Look for a
react-leafletcomponent that you can wrap, that’s often a lot easier than to wrap a “raw” leaflet plugin - When you are happy with the plugin, make a PR including an example demonstrating the usage. Note that if your plugin is large, you must load it async
Here is an example for a recent PR following this flow,
Thanks again Emil, definitely will try the approach!
Will start with PrintMap probably.
Best!
Hi @Emil, thank you for this.
I’m having some problems in getting the map to show and, unfortunately, all my data is coming from a .csv file.
My code is as follows
# Import Dash and Dash Bootstrap Components
import dash
import dash_bootstrap_components as dbc
from dash import Input, Output, dcc, html, dash_table, State
import dash_leaflet as dl

# Import Core Libraries
import pandas as pd
import plotly.express as px
import plotly.graph_objects as go
from dash import Input, Output, dcc, html, dash_table
from dash_extensions.javascript import assign


df = pd.read_csv('https://docs.google.com/spreadsheets/d/e/2PACX-1vQsJNecpTfW1vwk-OSS6IjoDL5k-_qFrxEZn4ottbiGGqAN86oaX_y6nE30EBPuhobcErja--wogCVt/pub?gid=1498261538&single=true&output=csv')

# Create markers from data frame.
markers = [dl.Marker(position=[row["Latitude"], row["Longitude"]]) for i, row in df.iterrows()]

# App Starts Here
app = dash.Dash(external_stylesheets=['https://codepen.io/chriddyp/pen/bWLwgP.css'])
app.layout = html.Div([
    dbc.Row(
            [
        dbc.Col(
            dl.Map(children=[dl.TileLayer(url="https://a.tile.openstreetmap.org/{z}/{x}/{y}.png"), dl.LayerGroup(markers)],
            style={'width': "100%", 'height': "100%"}, center=[48.8264, 20.0068], zoom=7, id="map"),
            xs = 12,
        ),
        dbc.Col(
            html.H1("TESTE 01"),
            xs=4),
        ],

    ),
    ]
)
if __name__ == '__main__':
    app.run_server(debug=True)
For some reason I can’t get the map to show, only the HTML is showing.
I’m also having issues in understanding how to create a popup with the relevant information from my dataframe.
Any help with this would be really appreciated.
Disclaimer This is for an NGO project to help Ukrainian refugees. No commercial use will be made of the solution
@jgomes_eu your issue is with the layout. If you change the style to,
style={'width': "100hh", 'height': "100vh"}
the map should fill the screen.
Hi @Emil, thank you. However it seems that leaflet is not respecting the column size when I set xs=8.
Any ideas?
Hi @Emil , I’ve been wrangling with the leaflet search control option for a week now to zoom into the map using the name of the city but haven’t been able to add this feature to my map. Basically, I am trying to add that searcher to the map.I tried using the search control feature here: GitHub - stefanocudini/leaflet-search: Search stuff in a Leaflet map
However, the local javascript file does not seem to modify the behaviour of my map. I’d really appreciate your help!
Unfortunately, I am not sure it is not straight forward to use plugins not already available in dash-leaflet from the “outside”. The standard approach to port a plugin is,
- Fork the dash-leaflet repository
- Implement a new Dash component based on the plugin, exposing relevant options via Dash properties
- Create a PR for the new component. Note that if the plugin is large, you must use async loading
The recent PR on mini chart from @RenaudLN is a good example of how a such PR could look,
Thanks for the prompt response @Emil. Would it then be possible to implement an html script and merge it with Dash somehow? I have implemented the solution in vanilla HTML and JS. I am just not sure how to integrate that with Dash. Any help would be great. I can share the individual codes with you.
I am quite new with dash so creating my own plugin would be quite a task. I am looking for a work around.
I am not aware of anyone having done it before. But if you manage to do it, I would like to see the solution ![]()
Dear Emil, I was wondering how could I style the dl.Popup.
Even if I make it with classname and style it in the external CSS, it is not possible, because dl.Popup is complex of several divs: .leaflet-popup, .leaflet-popup-content-wrapper, .leaflet-popup-content - I wanted to make their background-color: transparent, in order to style the div I am providing on feature click with whatever I want.
When I change their style in the CSS - I could see it in changes in the app, but when reload, again the normal style apears.
So, I suppose that I should change the style of these internal classes in dash_leaflet.min.js? Or?
Thank you for a lovely component. I am interested in implementing a custom map/reduce for supercluster that shows the sum of a property rather than the count of items. I have been looking at the supercluster documentation and I understand that I need to implement an object constructor. Here’s the Javascript test code in the supercluster repository:
test('aggregates cluster properties with reduce', (t) => {
    const index = new Supercluster({
        map: props => ({sum: props.scalerank}),
        reduce: (a, b) => { a.sum += b.sum; },
        radius: 100
    }).load(places.features);

    t.same(index.getTile(1, 0, 0).features.map(f => f.tags.sum).filter(Boolean),
        [146, 84, 63, 23, 34, 12, 19, 29, 8, 8, 80, 35]);
    t.same(index.getTile(0, 0, 0).features.map(f => f.tags.sum).filter(Boolean),
        [298, 122, 12, 36, 98, 7, 24, 8, 125, 98, 125, 12, 36, 8]);

    t.end();
});
I understand that dash_leaflet can bind functions to properties, but I do not see how this can be used in this case. (I would also be happy to do this in the mapbox component if that is a possibility, but I did not see support for clustering in the API). Thanks for any advice that the community may offer.
Thanks! I believe it should be possible via a custom clusterToLayer function,
That makes sense, I can see how I can get this done. Thank you Emil.