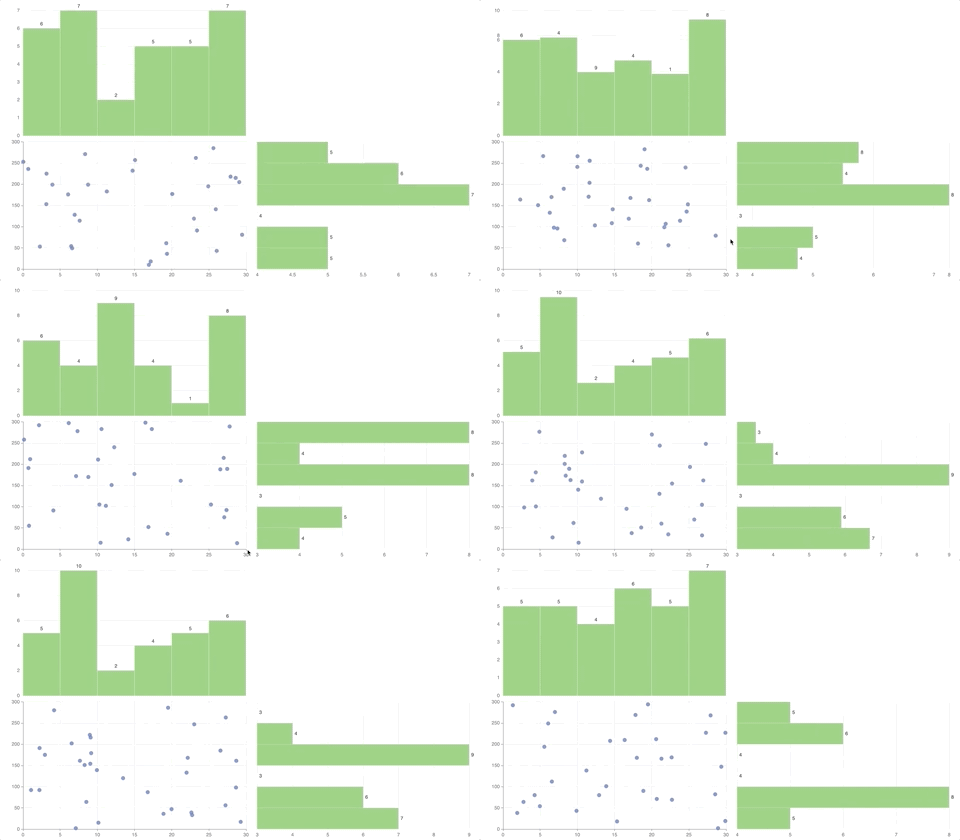
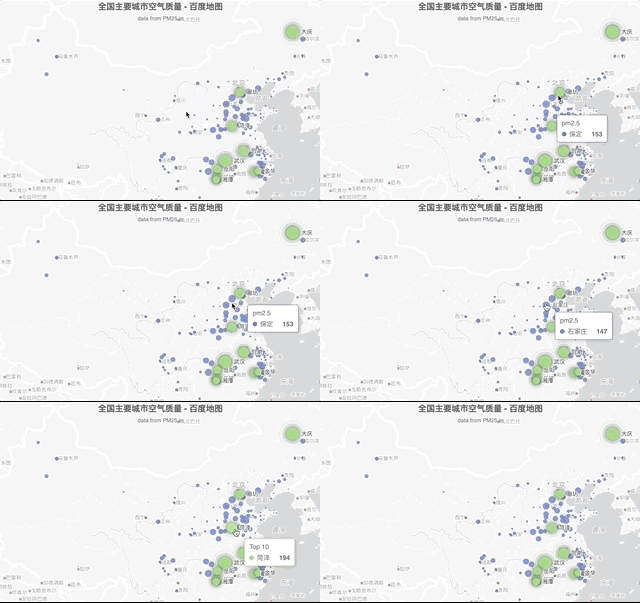
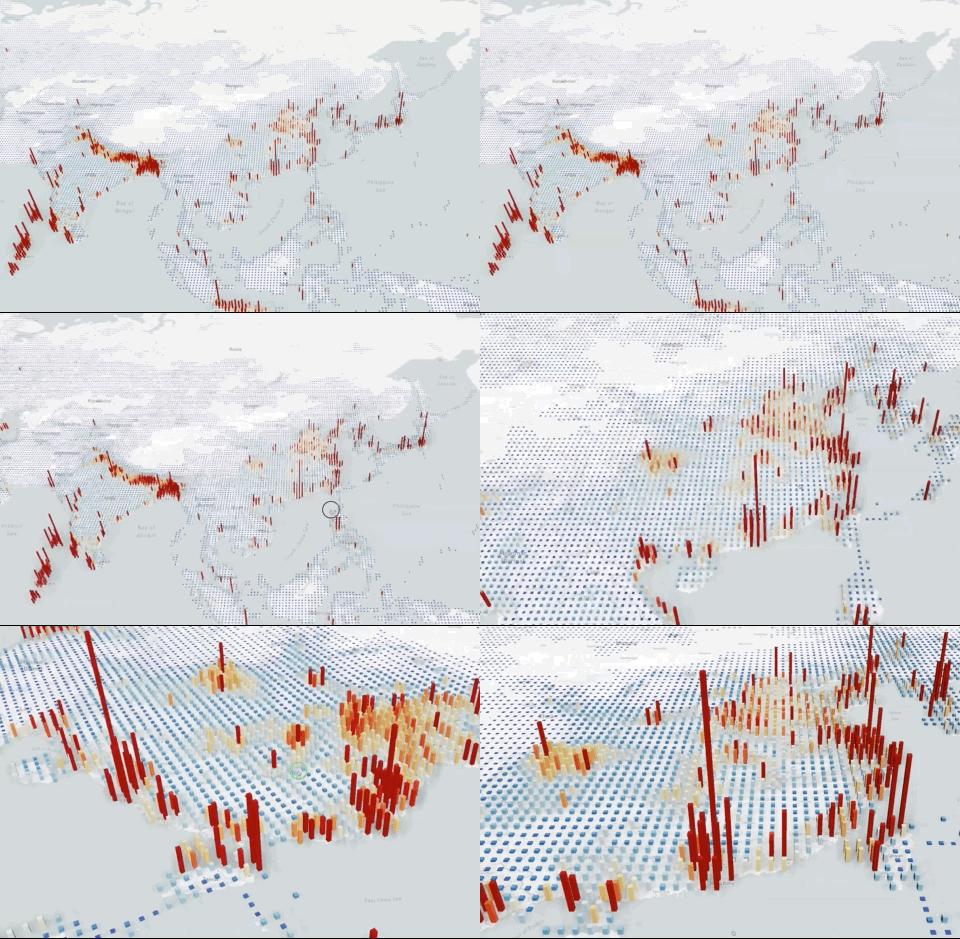
there’re two ways to use echarts with dash(for the events part),
- use the dash’s event system
- use js directly
dash_echarts support both ways
-
for the dash way,
currently, clicking(almost fully tested, via click_data callback attribute) and selecting is event (but not fully tested for selecting points in scatter chart),
-
directly using js in dash_echarts
for hovering, dash_echarts supports embeded js via funs and fun_values/fun_keys properties,
I strongly recommend using echart’s hovering feature, we can use almost all of echarts’ own examples via the embeded js.
click_data usage
import dash_echarts
import dash, random
from dash.dependencies import Input, Output
import dash_html_components as html
import dash_core_components as dcc
from dash.exceptions import PreventUpdate
from os import path
import json


def main():
    '''
    dash_echarts examples
    name: china map
    author: dameng <pingf0@gmail.com>
    '''
    app = dash.Dash(__name__)

    option =  {
        'title': {
            'text': '中国地图测试',
            'subtext': '中国地图测试',
            'sublink': 'localhost:8050'
        },
        'tooltip': {
            'trigger': 'item',
            'formatter': '{b}<br/>{c}'
        },
        'toolbox': {
            'show': True,
            'orient': 'vertical',
            'left': 'right',
            'top': 'center',
            'feature': {
                'dataView': {'readOnly': False},
                'restore': {},
                'saveAsImage': {}
            }
        },
        'visualMap': {
            'min': 0,
            'max': 200,
            'text': ['High', 'Low'],
            'realtime': False,
            'calculable': True,
            'inRange': {
                'color': ['lightskyblue', 'yellow', 'orangered']
            }
        },
        'series': [
            {
                'name': '中国地图测试',
                'type': 'map',
                'mapType': 'china',
                'label': {
                    'show': True
                },
                'data': [
                    {'name': '河南省', 'value': 16.7},
                    {'name': '上海市', 'value': 0.634050},
                    {'name': '北京市', 'value': 1.641054},
                    {'name': '广东省', 'value': 17.972507},
                    {'name': '新疆维吾尔自治区', 'value': 166.4897},
                    {'name': '西藏自治区', 'value': 122.84},
                ],
            }
        ]
    }

    # events = ["click"]
    basepath = path.dirname(__file__)
    filepath = path.abspath(path.join(basepath+'/static', 'china.json'))


    with open(filepath) as json_file:
        china_map = json.load(json_file)

    app.layout = html.Div([
        html.P("hello", id='output'),
        dash_echarts.DashECharts(
            option = option,
            # events = events,
            id='echarts',
            style={
                "width": '100vw',
                "height": '100vh',
            },
            maps={
                "china": china_map
            }
        ),
    ])


    @app.callback(
        Output('output', 'children'),
        [Input('echarts', 'click_data')])
    def update(data):
        if data:
            return f"clicked: {data['name']}"
        return 'not clicked!'


    app.run_server(debug=True)

if __name__ == '__main__':
    main()


![]()


