Bigger plans than just simple navigation, thought it was now post-worthy. Any help with the layout would be appreciated  or the switch field toggle.
Bigger plans than just simple navigation, thought it was now post-worthy. Any help with the layout would be appreciated or the switch field toggle.
Hi All, I’ve written an little app that demonstrates using Dash as a front end for Elasticsearch
Not quite done yet but this is by far my most in-depth project to date:
https://openmc-dash-interface.herokuapp.com/parameters/material
Alumni affiliation with NUEN department
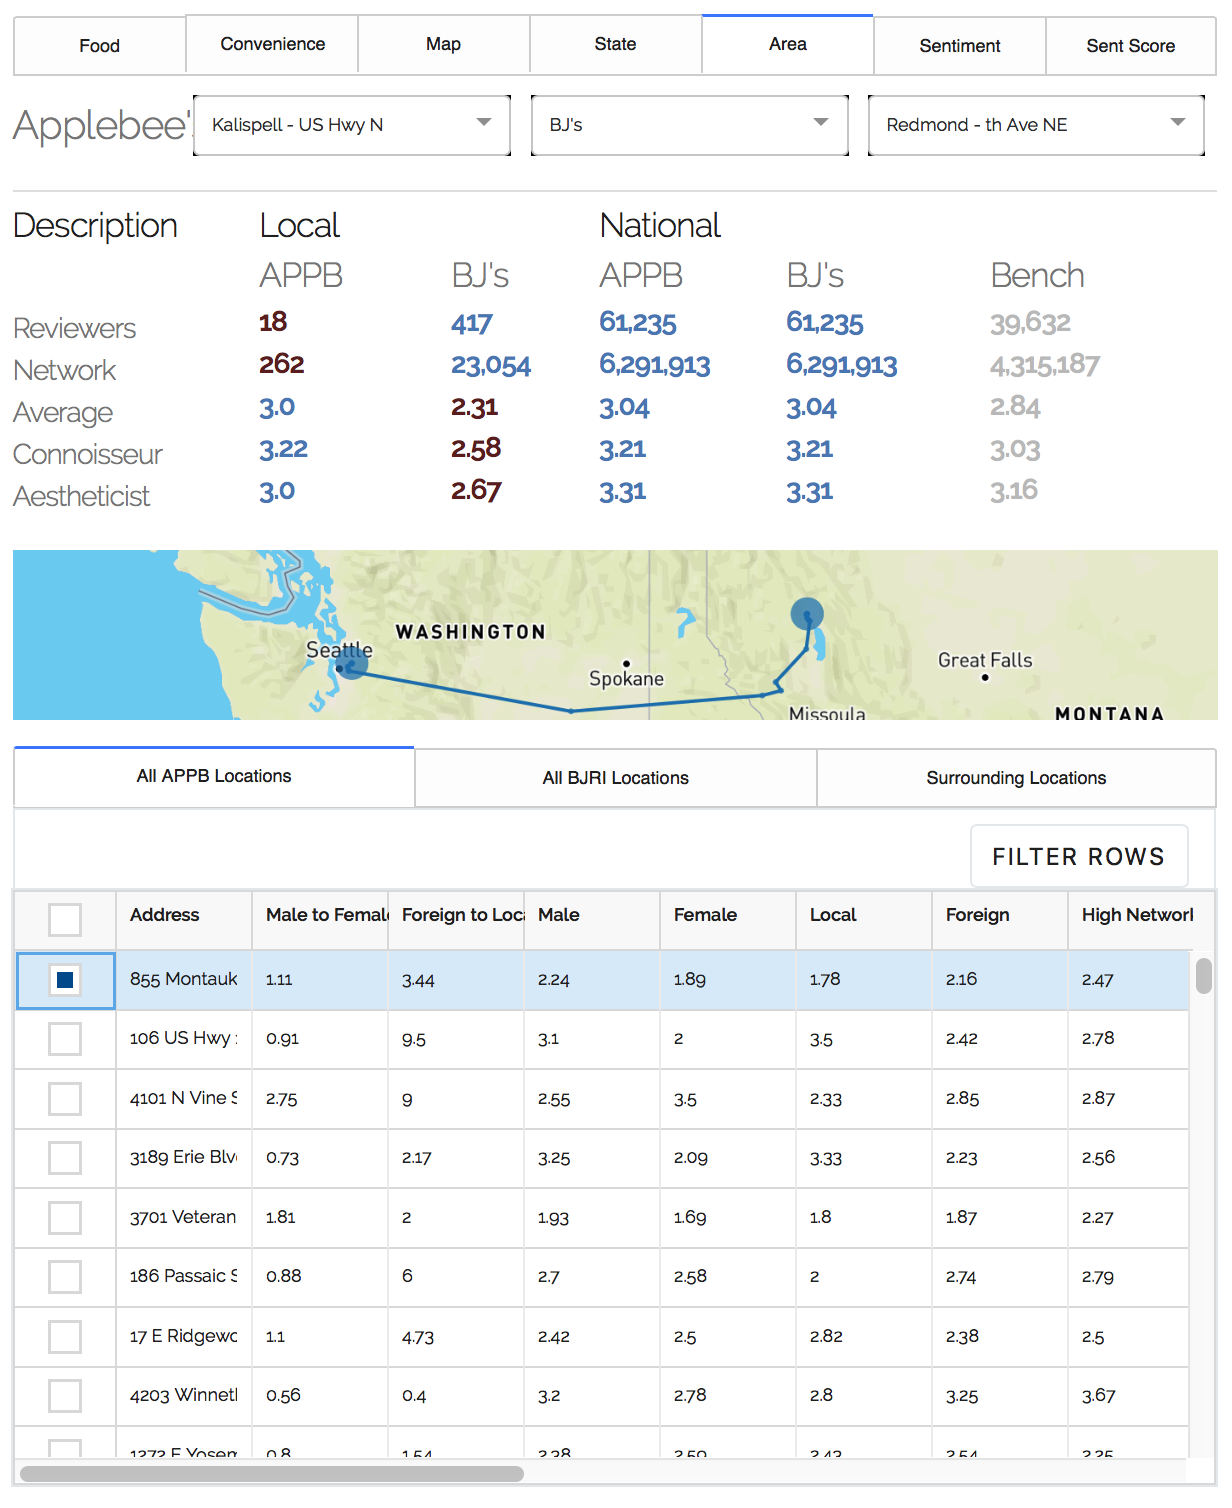
Automated machine learning company report in an interactive ‘PDF style’ from four dimensions: employees, customers, shareholders (owners) and management. Based on the GS report here. If I can ask anything of the community, it is more template boilerplates, they are extremely helpful.
For a sampled version of the report see FirmAI Report.
This report endevours to provide ratings of four corporate dimensions: employees, customers, shareholders and management, as benchmarked against competitors. It also shows the change in ratings over time. In a final step, a machine learning model compares all the metrics (about 80) with company valuations to establishes whether a firm is under or over-valued. It most notably predicted that BJ’s Restaurants were significantly undervalued at the end of 2017, within 6 months the stock price doubled. If you look at the chart, which shows the portfolio performance of $100 (not the stock price) over five years, the light blue line is the ML valuation, and the dark blue line is the real market value.
This report consists of Programmatic Competitor Analysis, NLP Sentiment Analysis, NLP Summarisation, ML Time Series and Cross-Section Prediction (Valuation, Closures, Geographic Opportunity), Employee Growth and Qualifications Measures, Location Ratings, Rating Growth, Social Media Analytics, Compensation Satisfaction Analysis, Interview Analysis, Product Analysis and Financial PCA. It is my hope that this report, analysis and generate data would benefit smaller firms who do not necessarily have access to this technology stack.
The report is built out of a Dash example. It is fully automated and updates on a monthly basis. It allows companies to study multiple competitors and company locations without strenuous user input. It is the first interactive report of its kind. It is in PDF style, making it easily digestible and also easy to print for meetings.
All information is extracted from the public domain using modern programming tools. This report uses state of the art machine learning and natural language processing techniques for deep sentiment analysis and prediction tasks. The report looks analysis a company’s from four dimensions, being the employees, customers, shareholders (owners) and management. Information is gathered from numerous online sources, the majority of which do not sit behind pay-walls. This report serves the following functions.
The report will grow dynamically over time and eventually become more prescriptive in nature.
Hello, first off I’d like to thank Plotly and Team for Dash. Everything works as advertised and is very well documented. I found myself finding a ton of tips from the community especially those posted by @chriddyp - Huge Thanks!
Here is my project: Market Ahead - A Stock & Cryptocurrency research tool that helps you discover correlations with economic and trend data, performance streaks, and even finds similar price movements / fractals. Look forward to any feedback and suggestions! Attached are some screenshots. Cheers! -MA
Hi Dash Community,
Hello, first of all, I’d like to thank Plotly and Dash development team for these highly useful technologies. I found many useful tips from the community especially those posted by @chriddyp .
Here is a link to my Dash application which is a based on my PhD research. It provides an interactive visualization tool for rock physics studies. It helps geoscientists and specifically geophysicists to understand how rock properties vary due to the changes in the fluid content.
I have deployed the app on Amazon Web Services (AWS).
Rock Physics of Oil Sands
Thank you all
We have an exciting prototype for push (WebSocket) support and are looking for a partner to help us take it to the finish line:
Please reach out if your company is interested in a realtime streaming capability for Dash:
(cross-posted on GitHub:https://github.com/plotly/dash/issues/1110 )
I’m happy to share my first Dash project.
It’s not a sophisticated project, but this was my first web development project in all life.
https://trich-churncustomer.herokuapp.com/
I’m working in another one, and I intend to implement a predictive system in this Churn Customer project.
Thank you all the community, I’m learning a lot in the last weeks and I want to start to develop “real-life” projects very soon.
Feel free to suggest improvements, feedback or contact me on Linkedin/Kaggle
Wow that design is really good! Great work.
Hi Dash Community,
Here I want share with you my first dash app: coronavirus global case monitor. Here is a screenshot of the dashboard
I learned a lot from plotly community and thanks very much for the dash team.
Please feel free to comment.
Jun
Hi guys!
I’m happy to share with you my new Dash Web App Development.
It’s one where I have applied some NLP techniques like tfIdf, reviews clustering, information extraction with spaCy and with a system to recommend wines using a collaborative filtering system!
https://wine-app-recommender.herokuapp.com/
All the code is on my Github.
Feel free to give your feedback if you want or to add me on Linkedin!
I am excited to show an earthquake tracking system dashboard built by our team as a part of our project. I know it’s a basic stuff but an interesting one. It displays the real time results earthquakes across the world. Regions like Alaska, Canada, Indonesia, Japan etc are very prone to earthquakes. Almost 200-300 earthquakes happen on a daily basis in which most of them are not felt. Earthquake can be caused not just by the rupture of tectonic plates, there are also various other reasons.
In the part two of our project we sort of collected 50 years of earthquake data and visualized it on yearly and area based.
The real time app can be seen here
https://earthquake-tracking-system.herokuapp.com/
The blog for the model development can be found here
Thanks Dash community.
Hey everyone,
I’ve just redesigned the dash-bootstrap-components documentation app, which is itself a Dash app, and I thought people might be interested in some of the details. Read on if so, check it out here, or take a look at the source code on GitHub.
Structure: The app is actually 27 different Dash apps stitched together with Flask ( ). Each example and each of the component pages in the docs is its own Dash app. This is to let me control navigation without having to write callbacks, and to make it easier to avoid component
 id clashes within each app. I use DispatcherMiddleware to route requests to the relevant apps, as recommended by the Dash docs. These apps are of course generated rather than all instantiated manually.
The HTML pages are generated from jinja2 templates, which I also use to generate custom index_strings for each of the apps so that they match the style and structure of the rest of the app.
Components pages: As mentioned above, each of these is a Dash app with a custom index_string to add the navbar and sidebar etc. Each component page is mostly text content with interspersed code snippets + live examples running those code snippets. To help make this more maintainable they are written as markdown templates. Here’s the template for the Button docs for example. A custom markdown parser reads this, and when it sees something like {{example:components/button/simple.py:buttons}} it loads the Python object buttons from the specified file and drops it into the layout.
Examples: These are running apps from the examples folder in our repo. Code from the examples folder gets copied into the docs folder at deploy time (to make sure the example apps on the site are running the same code that is present in the repo). Rather than just running the app though, we make a new app so we can ensure we have the correct URL prefixes set etc., copy the layout and callbacks across from the original app, and set a custom index_string using jinja2 templates, so that the example app appears to be embedded in the documentation (like this). In actual fact the Dash app that is running is also responsible for the navbar at the top and the source code below the example, but the example code would generate only what’s visible in the window.
Style: All of the styling is done with Bootstrap (would be weird to make a different choice for this particular app  ) and is responsive, almost all of it looks pretty good on mobile and smaller screens! The app also includes some CSS to replace the
 Loading... in each of the Dash apps with a Bootstrap style loading spinner.
Anyway, hope that was interesting if you read this far. There were definitely some interesting technical challenges to solve making it.
Thanks a lot for sharing!
I was wondering how to include jinja2 templates in index_string and following what you did helped me greatly!
Do you know if there is a large performance difference between registering each app to the flask server and using DispatcherMiddleware?
I haven’t actually benchmarked it, but I wouldn’t have thought it is going to make a massive difference. Each app is a collection of functions for processing requests, and rules for which function is used based on the route. In the multiple app case you just have an additional rule controlling which app is used to handle the request.
One thing I did do to help performance was set serve_locally=False on all the apps. If I didn’t do this, then the JavaScript bundles would be served by the underlying Flask server for each app and fetched from something like
/app1_prefix/_dash-component-suites/dash_renderer/dash_renderer.vXXX.js
I.e. the location of the bundle changes for each app. By fetching them from a CDN the location doesn’t change between apps and the browser can do some caching between pages.
I contribute a Python Interactive Dataviz Covid-19 Dashboard - it’s open source, has very little code (focus on the .py), included plotly express animating timeline, simple plot interaction - brushing/linking of barplot. See 'about this dashboard, updates John Hopkins data daily, I’m open for contribution and ideas, or thinking about doing a demo/tutorial article or webinar if there’s any interest.
Hey guys,
after almost a week of headaches to deploy this project, I finally did it.
I’m happy to show to you all my new project using Dash/Plotly, and this time, it’s a system where I can collect and analyze the data in the fly.
https://bbb-twitter-monitor.herokuapp.com/
I intend to keep improving the layout and also implementing new features that can make it more robust and useful to commercial solutions.
I hope it can inspire some of the other users to create new solutions based on it.