Hi all, quick one. Clues is a data viz tool for non-coders: people who have a CSV and questions but won’t touch code. It’s a single HTML file, all client-side, so nothing leaves the browser.
I’m sharing it here because it does a few things a one-off chart can’t: every chart is a reproducible spec (same input, same figure, every time), you can sign a dataset for an auditable trail, a whole session is shareable as one self-contained HTML file, and it can hand an AI assistant a Plotly-aware brief and import a JSON view spec back, so the AI proposes and the app draws deterministically.
Styling through AI: Clues - Google Chrome - 2026-07-05_21-42-45 - TechSmith Screencast
It’s built entirely on Plotly.js, which does all the rendering. Free and open source.
My bad… I was playing with some updates for a presentation mode that hides the left side panel. You can toggle it on with the icon on the upper left.
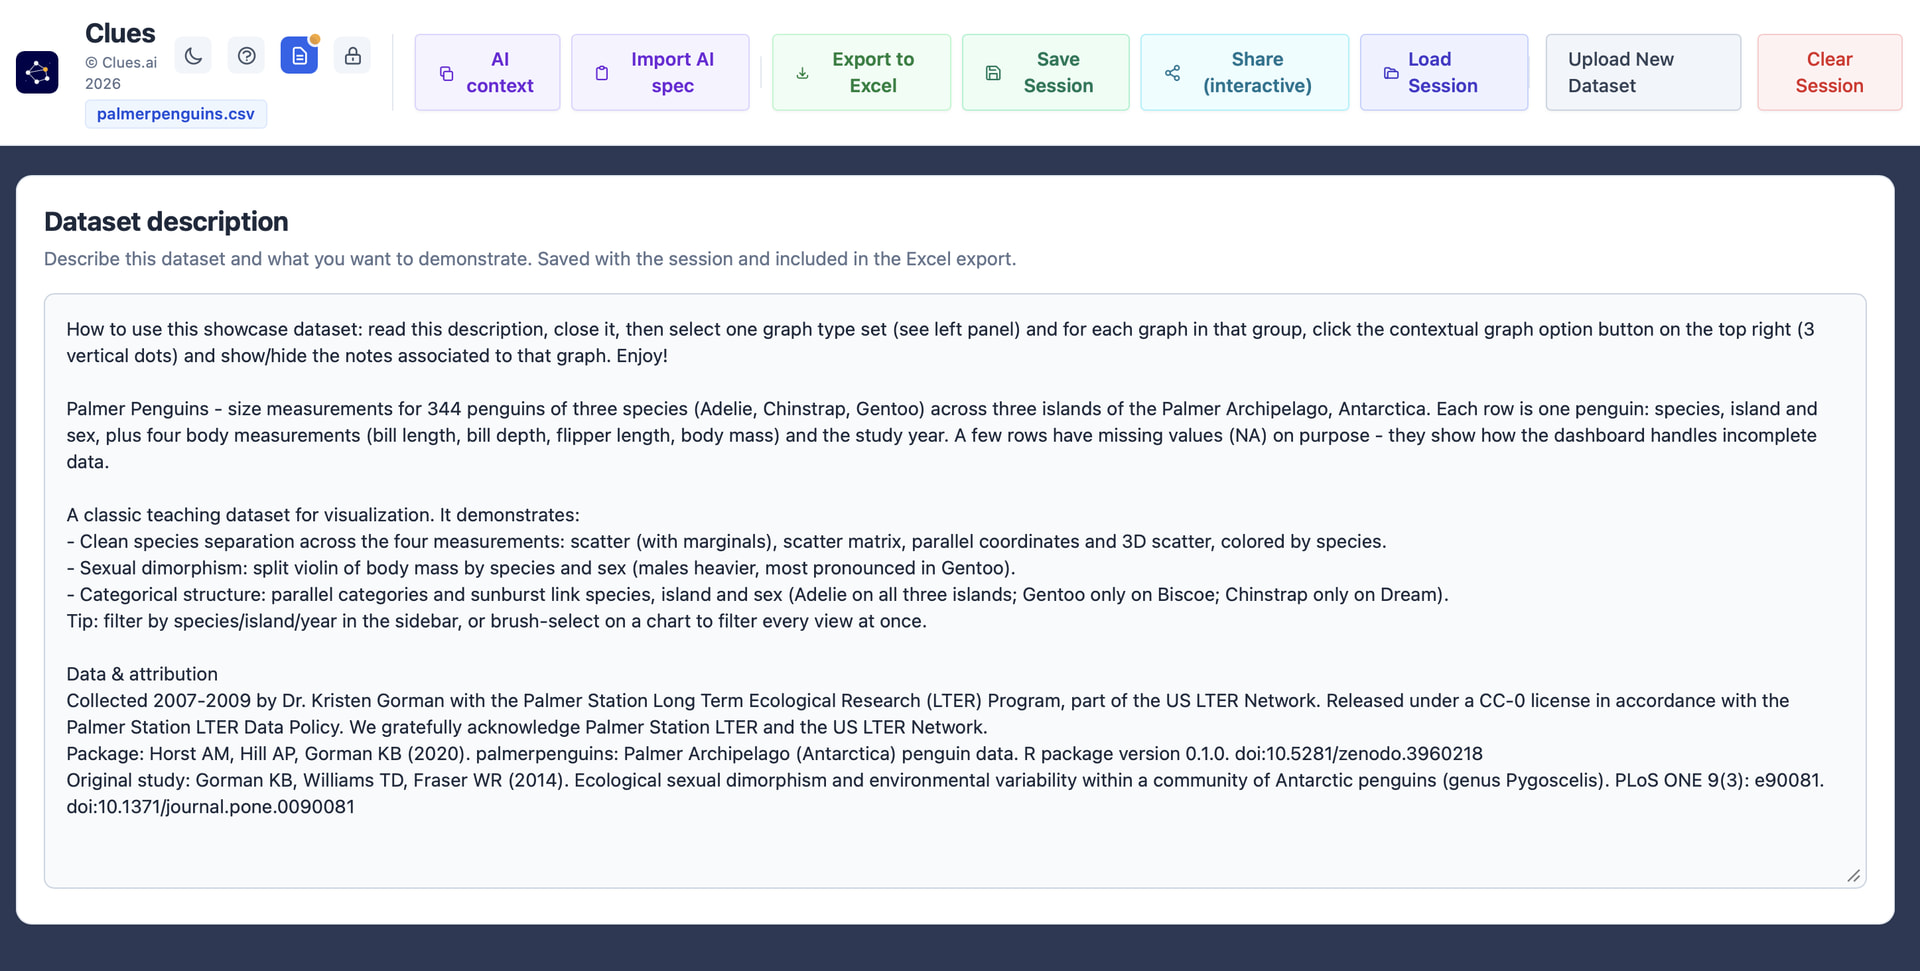
The demo of the Palmer Penguins shows a few of your chart types. All thee demos were built using the UI controls. But the App “provides its methods and the current datasets and graphs” via the clipboard that you can paste in an LLM as is. See section 12 of the user guide: clues/USER_GUIDE.md at main · clues-app/clues · GitHub
On a computer: download clues.html and you are good to go with the preloaded showcase dataset of the Palmer penguins. On a mobile device , you can only display a presentation that was exported (a “.clue” file)
Please let me know if any issues and of course, any feedback. Thank you for your awesome library!
Max
Yes, initially it was just a dashboard for myself, but when I started to share with non-coders stakeholders, I realized that it would be simpler to just exchange an html file, including the dataset. The lasso tool in Plotly is especially useful because they can just isolate datapoints that need further verification, all this while I can keep working on the charts. So behind the hood, there is a mechanism to keep an audit trail on the data.
Since my users and non-coders, I started to add more and more UI to style, create graphs etc…But then I realized that it was difficult to tell users where to access what settings, so I added the optional AI context and validation: with a click, the user loads a context from its clues session, with or without a tiled picture of existing charts. The context informs the user’s LLM what it can do and what JSON format it expects for processing the user’s request. So the user’s workflow becomes: copying the context with a click, pasting it in the LLM prompt, copying the response to the clipboard, pasting with a click in clues for the validator who extracts just the needed JSON. An LLM can not only style the charts, but also assist the user to validate an hypothesis. My users are mostly on Gemini and I have some gems to ensure that the end result keeps the same theme overtime.
The part was adding the presentation feature…By just keeping the charts, some notes and optional images, a user can present something while keeping Plotly’s native interaction. Of course they can also download pngs or svgs.