Hey everyone - Really excited to share this feature that we launched today: Plotly Studio Embedded.
If you’ve been following my work over the last year, you may know that I’ve been heads down in building out Plotly Studio (Desktop): our take on what AI-enhanced data analytics and Dash app development that puts the data front-and-center.
Plotly Studio Embedded takes the core ideas and architecture from that product and makes it available on top of your Dash app. So that you can get a chart-making, data-inquiring AI agent alongside your app:
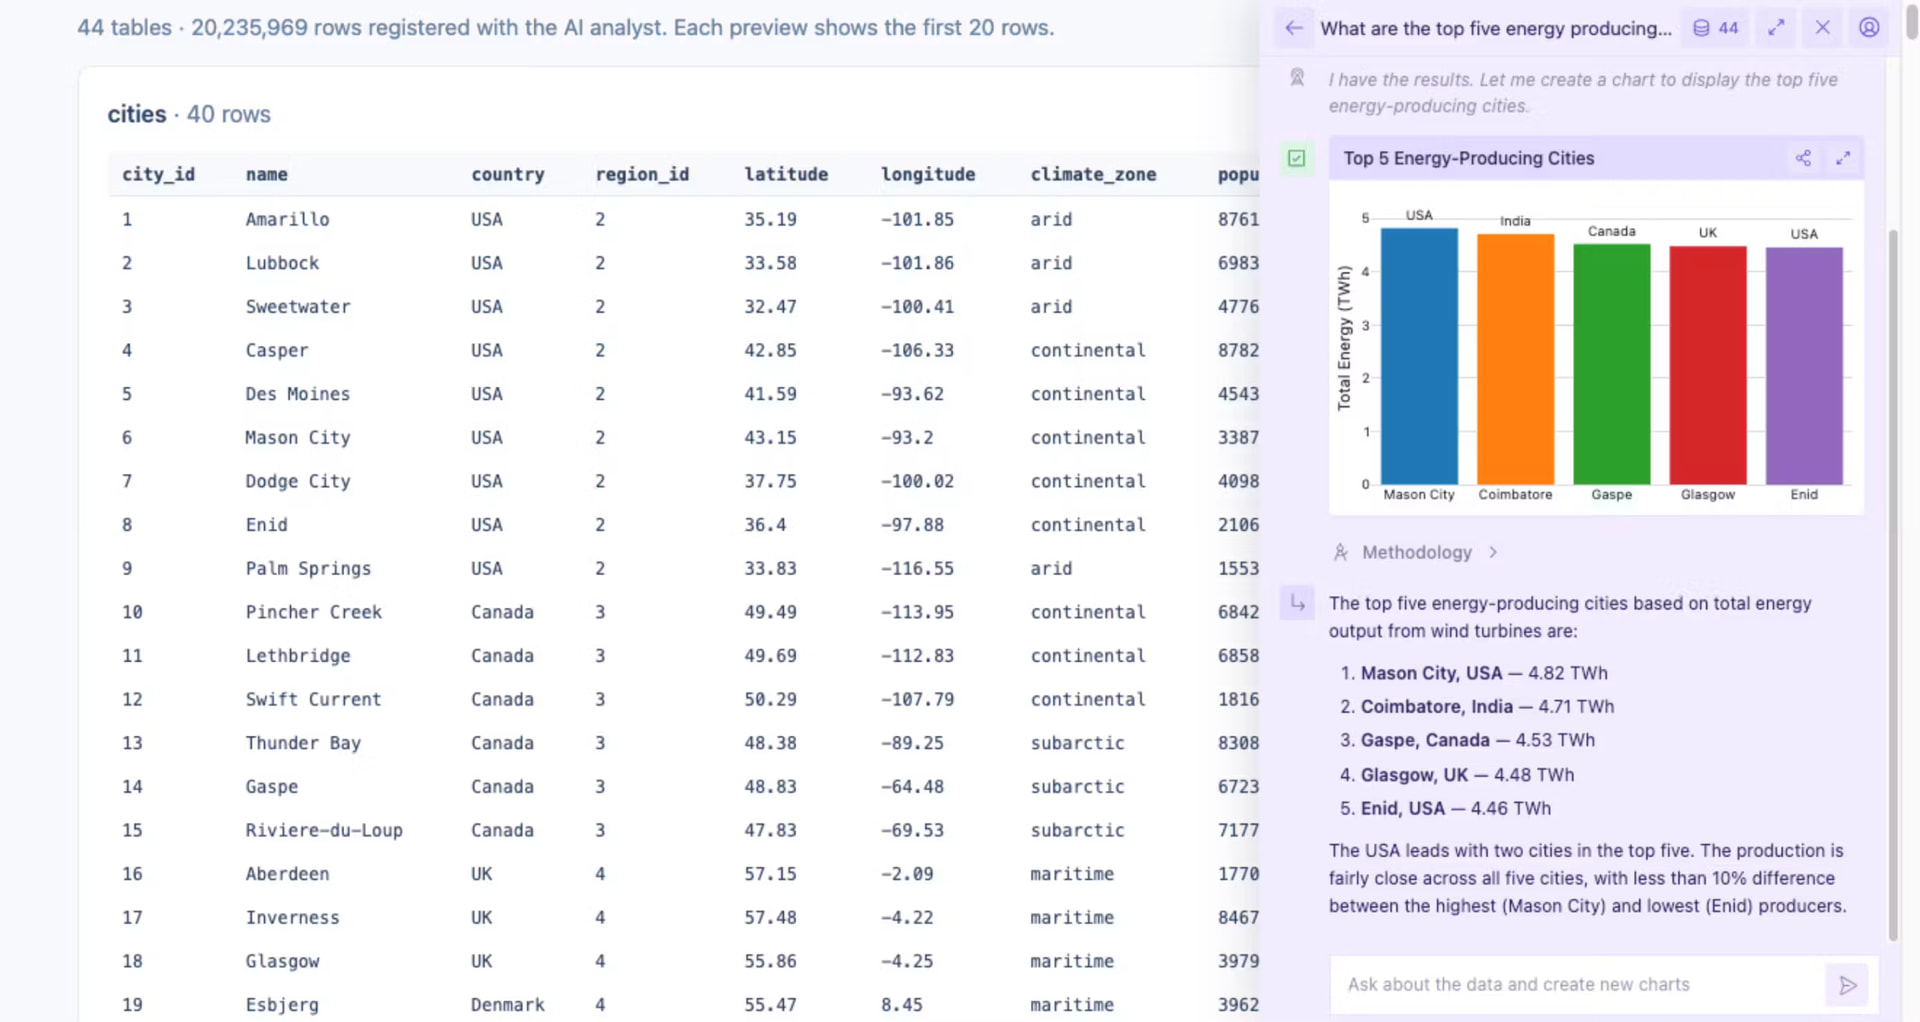
Every response has a “Methodology” section that outlines the queries that were made in order to produce the answer.
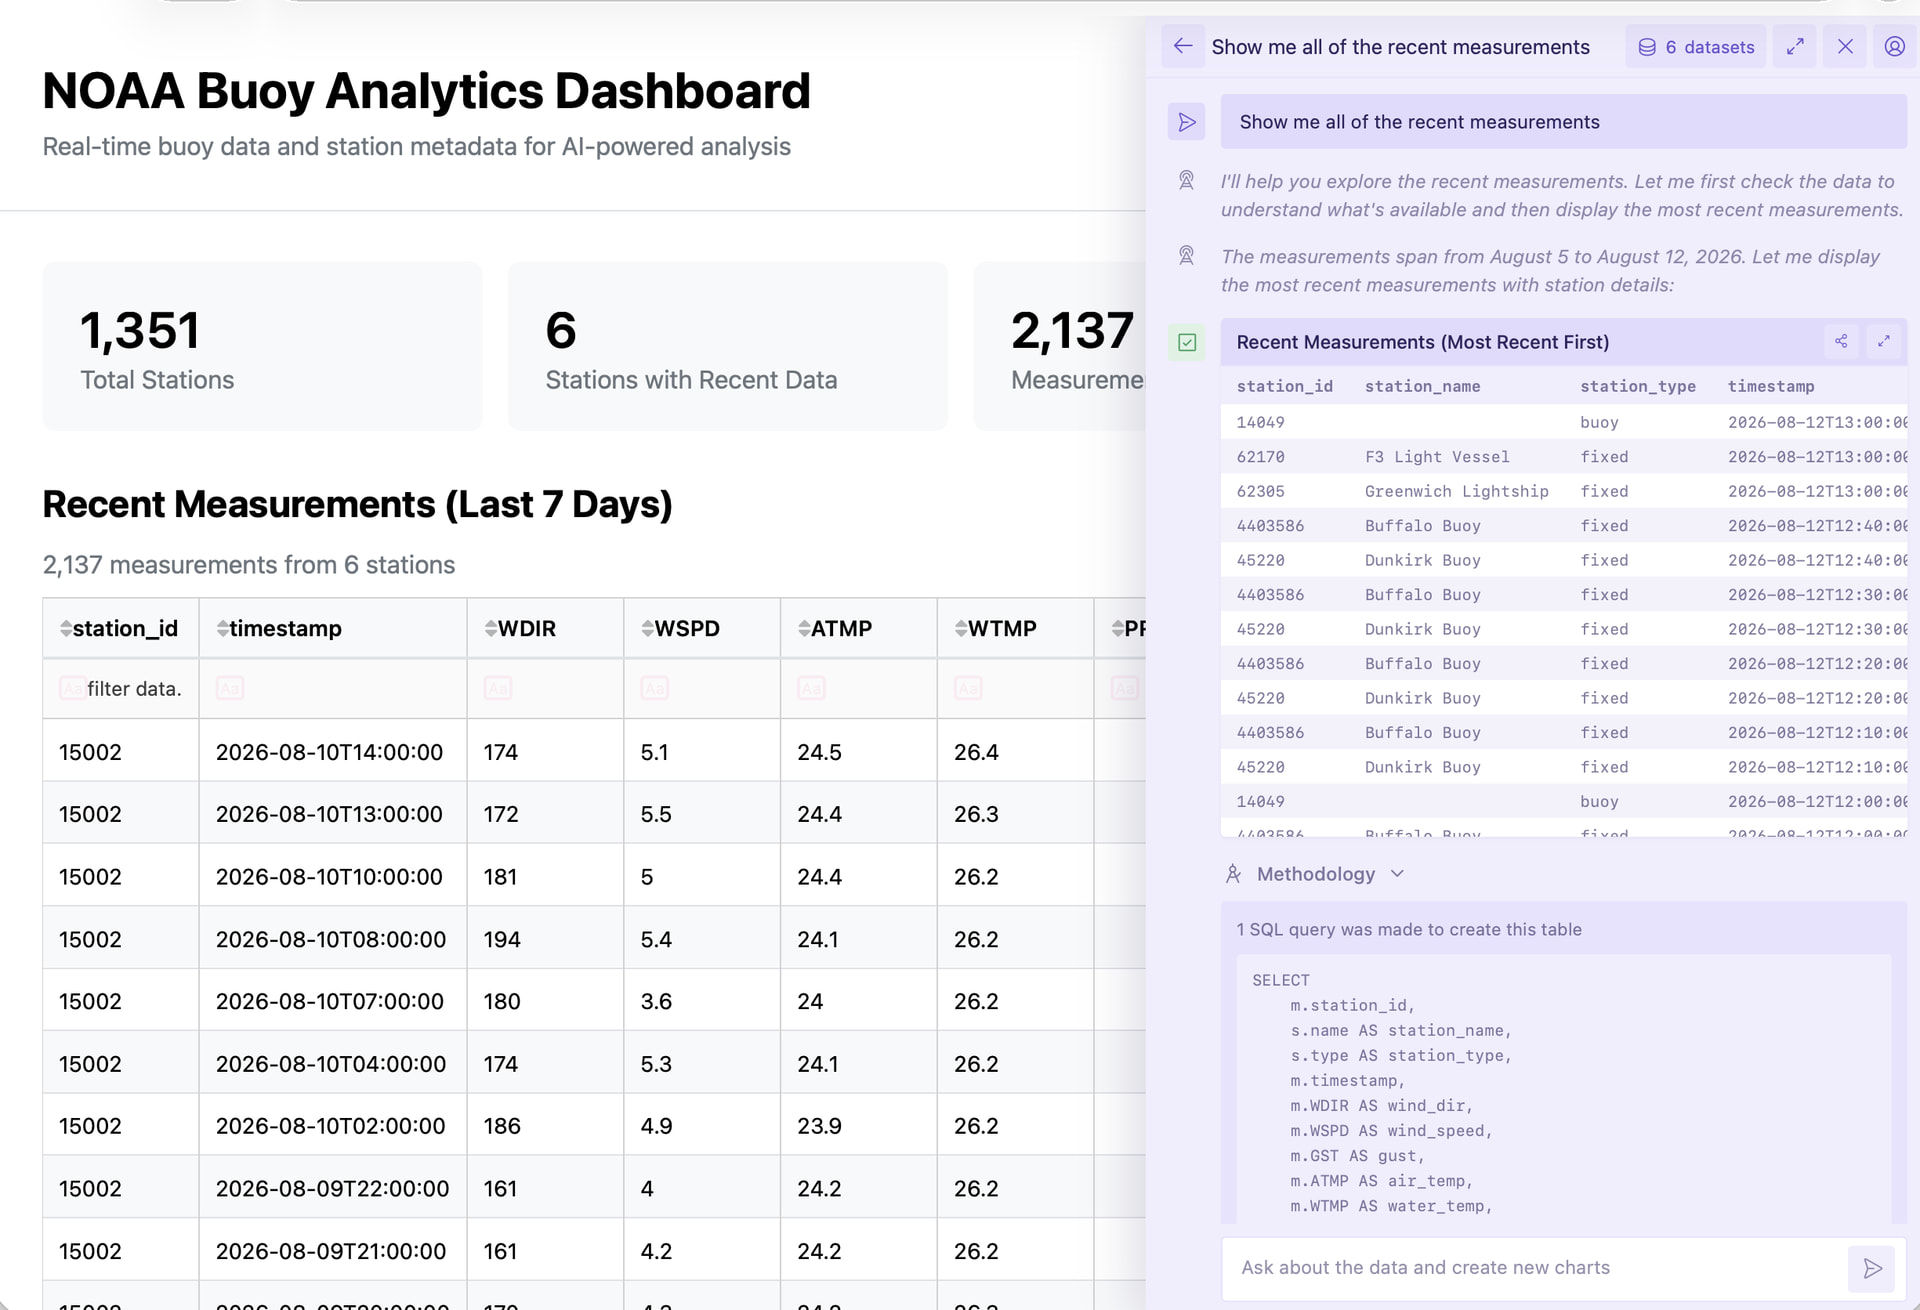
Sessions are saved and you can ask a wide variety of questions and tasks: create charts, sanity check results, explore data, look at the data a slightly different way, and so on.

All Plotly chart types are supported, including our nice Open Street Map satellite maps. Here’s an example showing NOAA water buoy’s in the SF bay area.
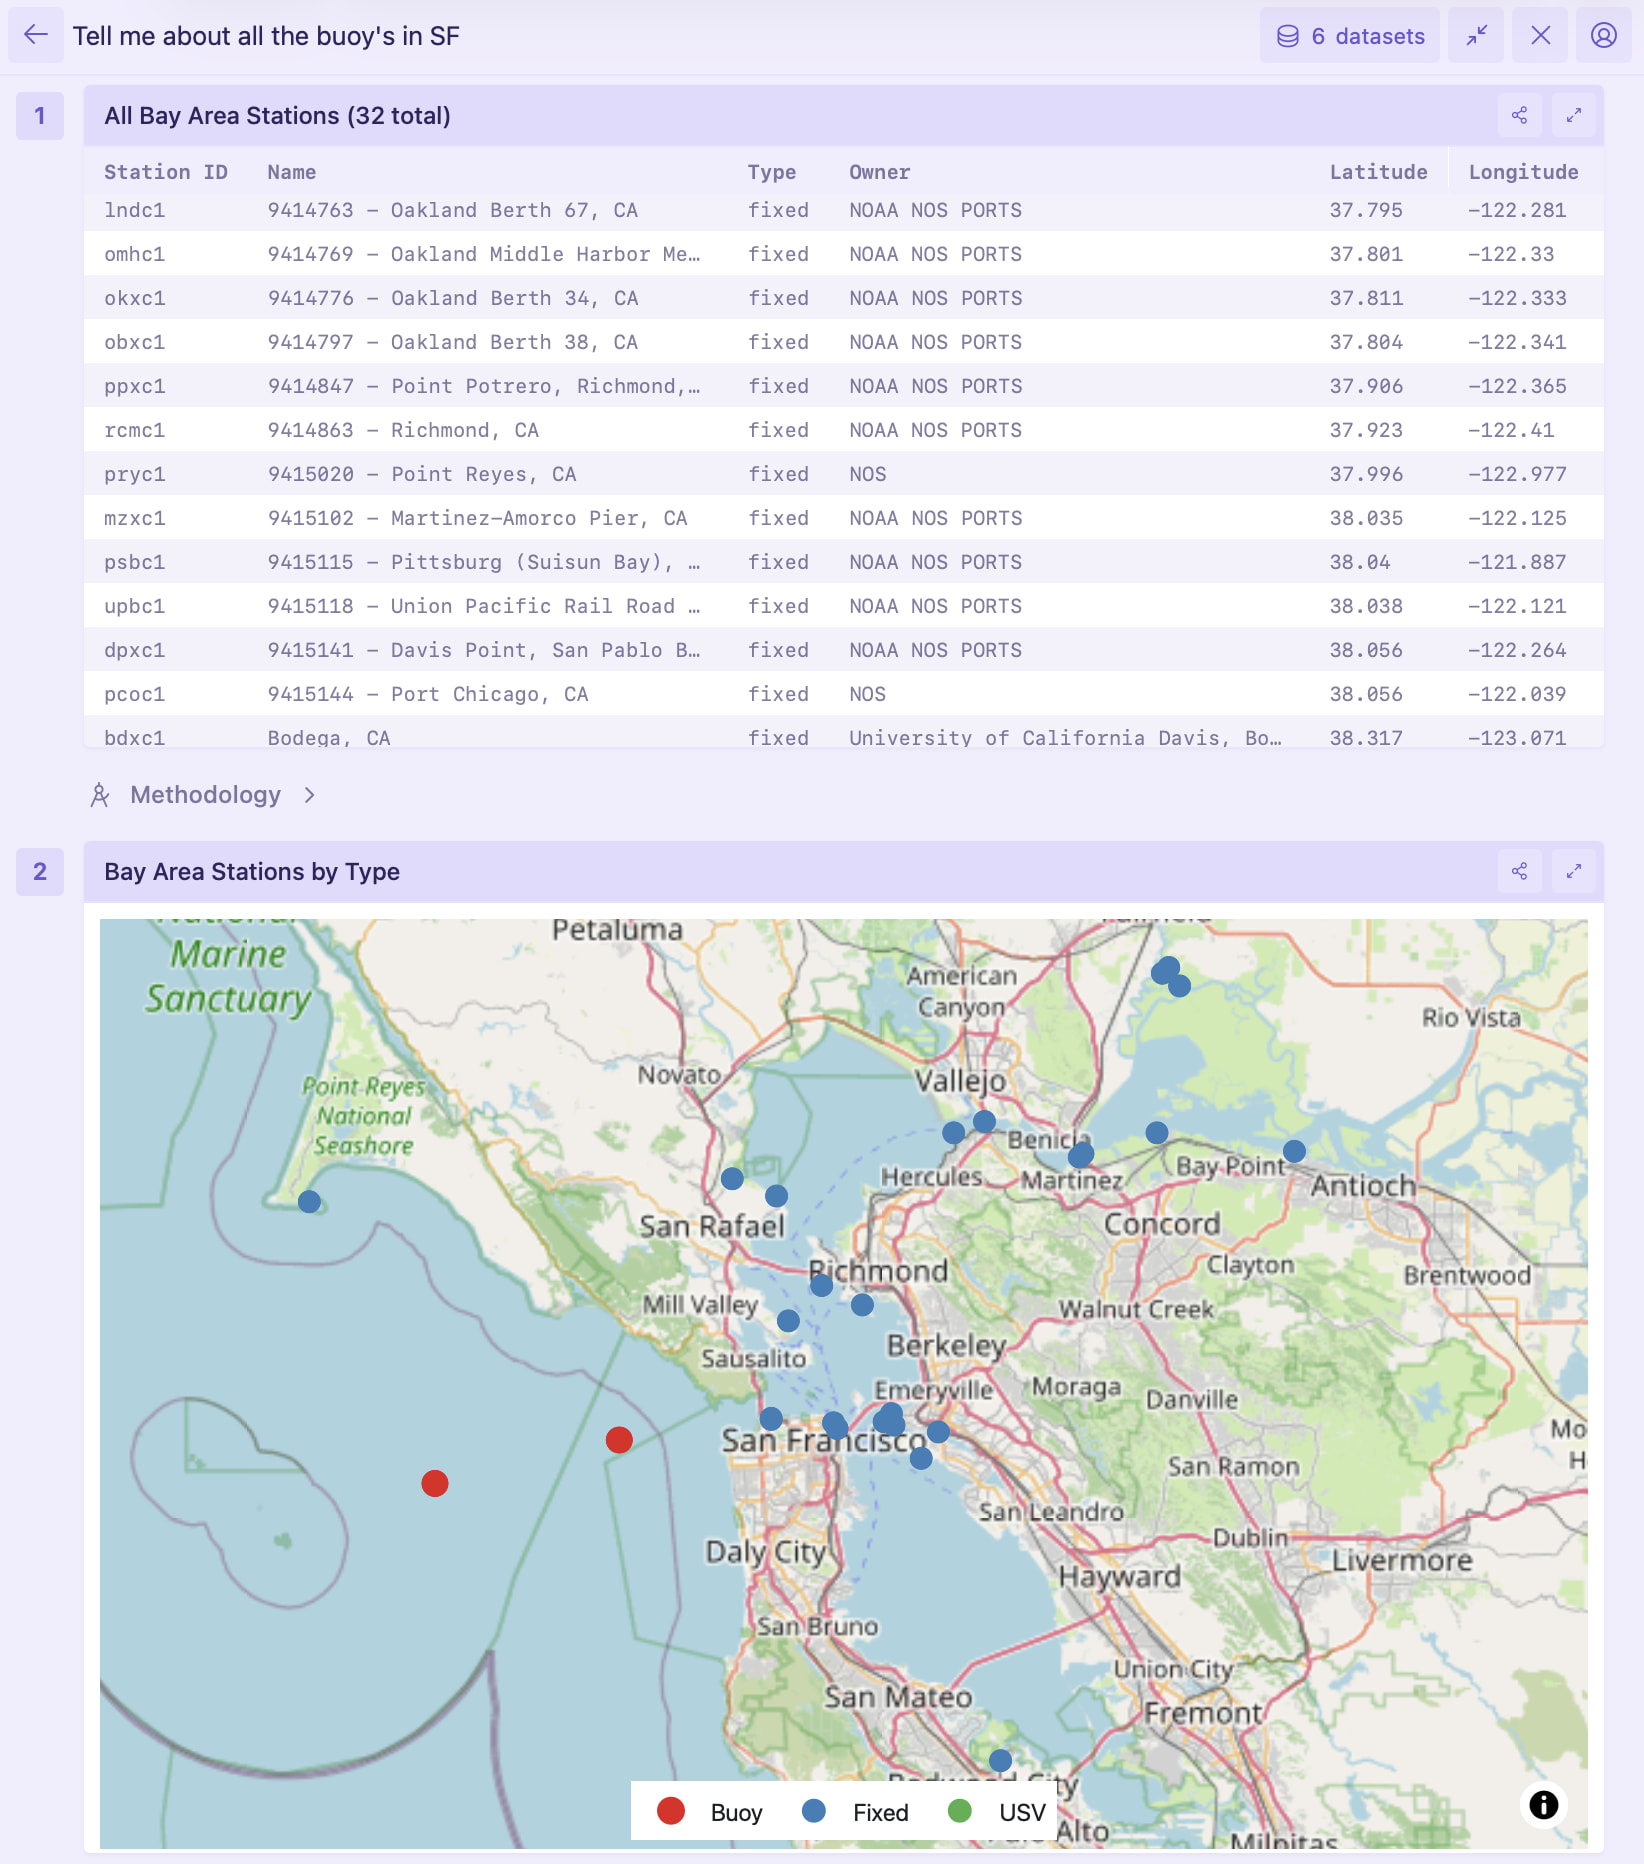
I’m very proud and excited about this. Open-ended AI-based analytics is such an amazing capability and it makes sense as part of the Dash app: end-users get both structured, predefined views and open ended AI experiences on the same URL.
The architecture is quite nice:
- No arbitrary tool calls: many AI systems like coding agents build really broad tool call capabilities for running arbitrary code. This gives you a lot of flexibility, but it grounds the experience in something more like “software engineering” rather than data analysis. It’s also a larger security footprint since those agents are so powerful (the industry saw them escape sandboxes last week). We designed Plotly Studio Embedded to only be able to do data queries and visualization so that it can’t exfiltrate data.
- Data access is determined programmatically: The same code that you use to query data in your Dash app’s codebase can be used to make the data available in the Dash app. Many AI tools are so open ended that end users end up needing to navigate a myriad of credentials and connectors to access their data. By configuring the data access in code in advance, you have a lot more control about restricting data access and you can do the heavy lifting upfront so that you’re users don’t need to fuss around getting things set up.
- Trustworthy: We’ve designed the product to be transparent and disclose its work. You can view the queries that it made and the thought process it took. The data at every step is presented front-and-center instead of hidden behind a thinking block. Its tone is neutral and it looks out for ambiguities in the data or the request. And we’ve done a lot of work in benchmarking the results and tuning the harness to perform data analytics and visualization at an expert level.
Getting started is quite simple:
- Expose the data in your Dash app in either global DataFrames variables (
df) or aget_data()function that returns a DataFrames. Pandas, Polars, PyArrow, and GeoPandas dataframes are supported. - Deploy your Dash app on Plotly Cloud
- Turn on the feature in your app settings.
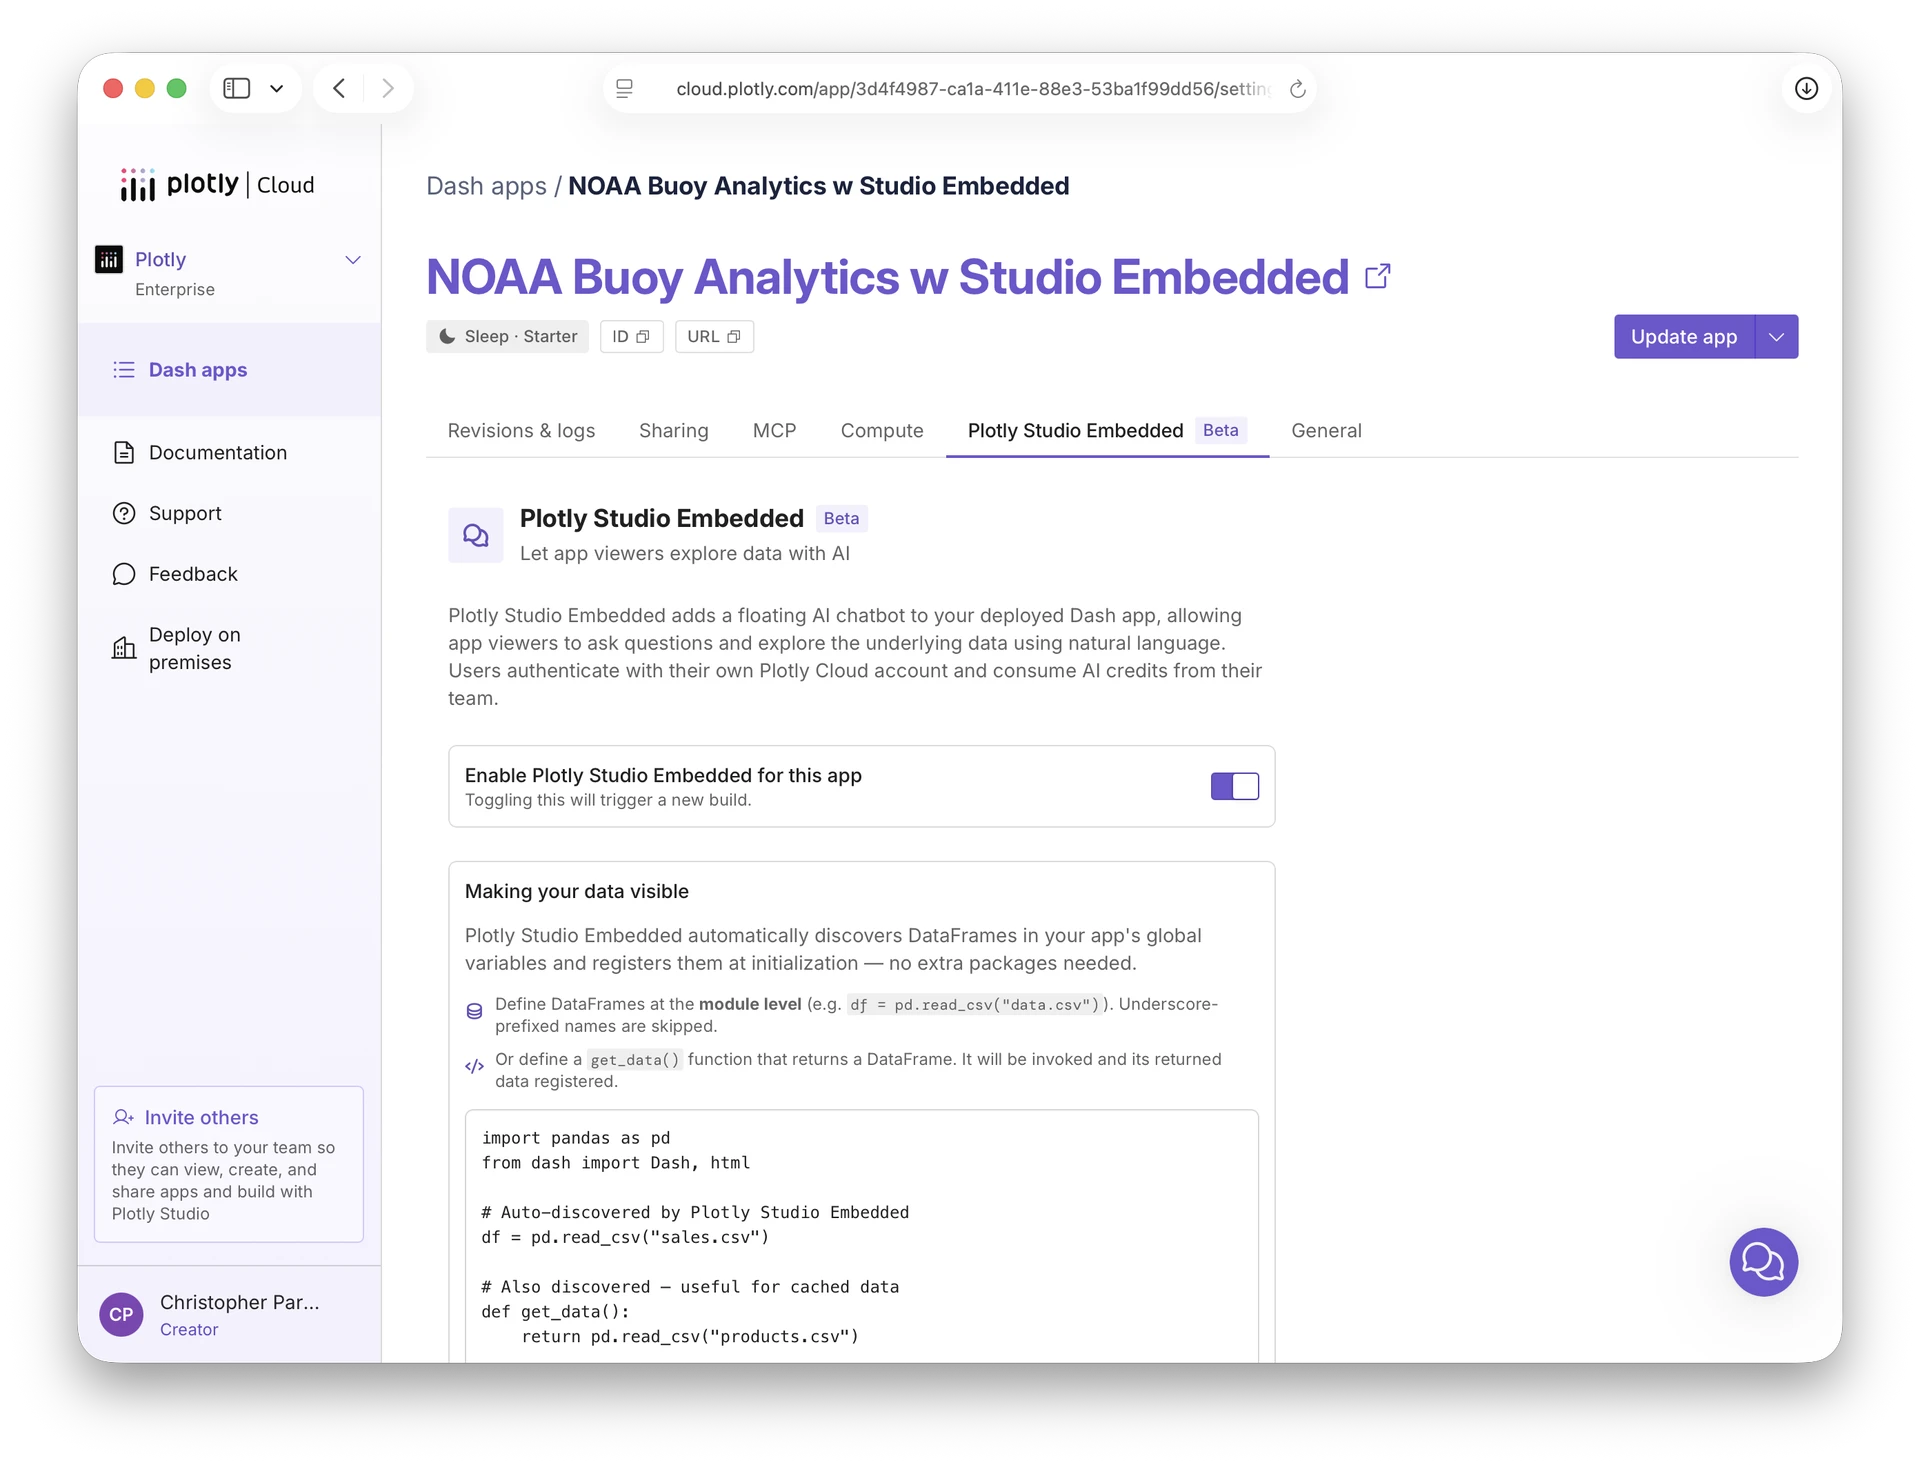
That’s it!
Give it a try and let us know what you think  And as always, if you want to talk about how this could integrate with your organization’s AI initiatives, reach out to us at Request a Demo for Enterprise Data Apps | Plotly