Hello everyone! We’re really pleased to have released Plotly Studio Embedded this week. Plotly Studio Embedded adds a very nice chart-making, data-querying chatbot to your Dash apps.
We’re going to have a launch event next week, you can sign up here.
Here’s a quick break down on how to get started. It’s just 3 steps:
Step 1. Build your Dash app
This app can be very simple. You just need to expose some data either as global dataframes or as a get_data() function:
import pandas as pd
from dash import Dash, html

# Auto-discovered by Plotly Studio Embedded
df = pd.read_csv("data.csv")

# Also works
def get_data():
    return pd.read_csv("data.csv")

app = Dash(__name__)
app.layout = html.Div("World's Simplest App")
Or you can add a get_data() function to any existing Dash app that you have.
Since it’s Python, the data can come from anywhere that you can connect to with Python - you can add a chatbot to your Databricks, Snowflake, Redshift, BigQuery or an API or a set of files! The options are limitless.
If you’re not comfortable coding or using a coding agent, you can also create this app in Plotly Studio Desktop. Here’s the prompt I used:
Find all of the water buoy's near SF bay area,
so that I can look at all of the latest and last
12 months water temp near SF beaches.

Then also return a dataframe of air temp data.

Finally, make a Dash app that exposes a `get_data()`
function that returns a list of these dataframes.
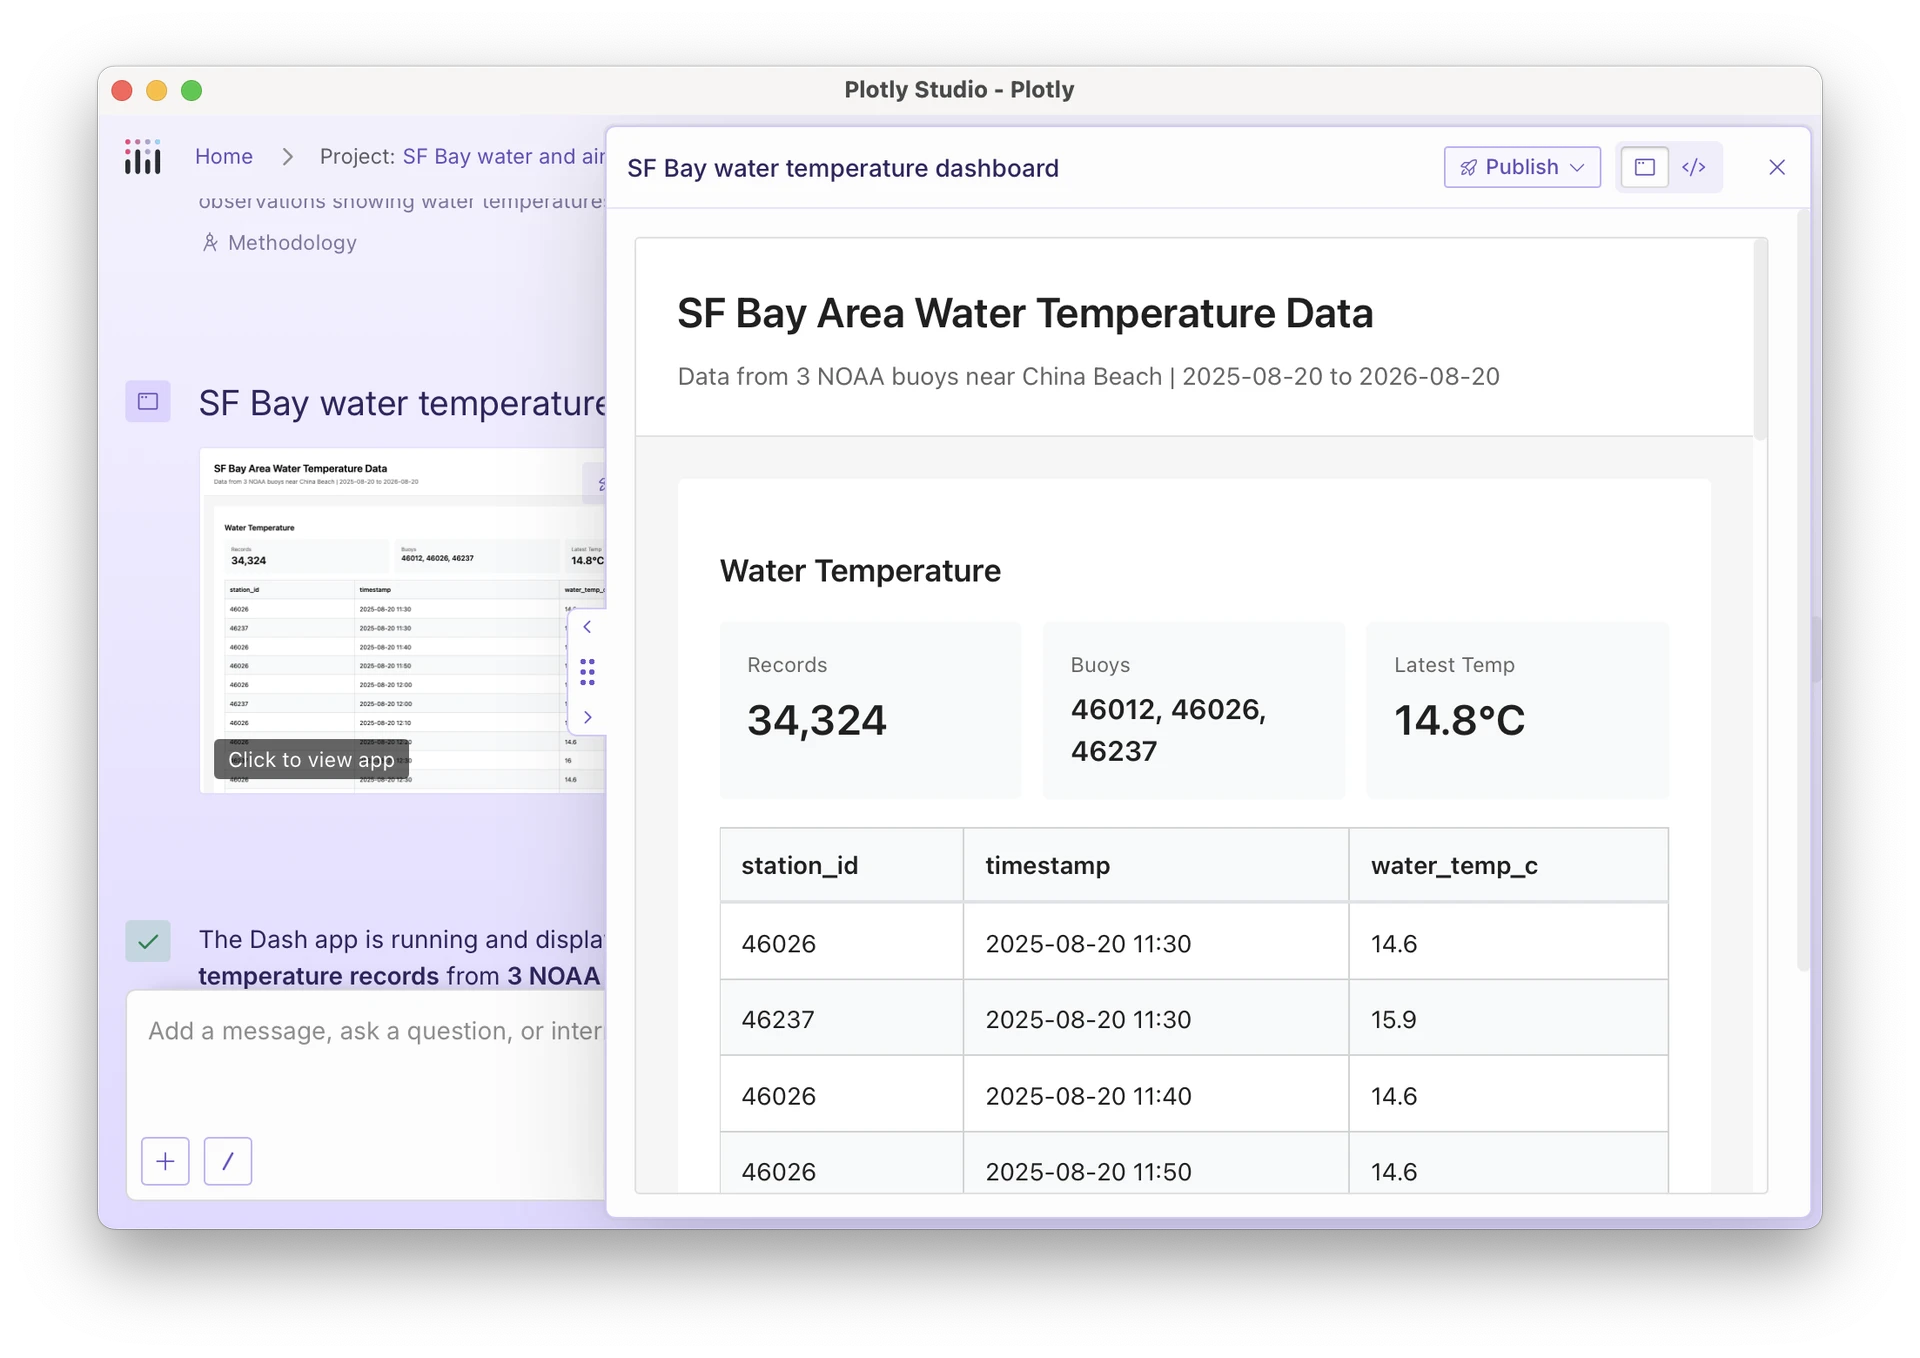
which then made this app for me in just a couple of minutes:
Step 2. Publish your app on Plotly Cloud
4 simple ways:
Option A: Publish your Dash app with the CLI:
$ plotly app publish
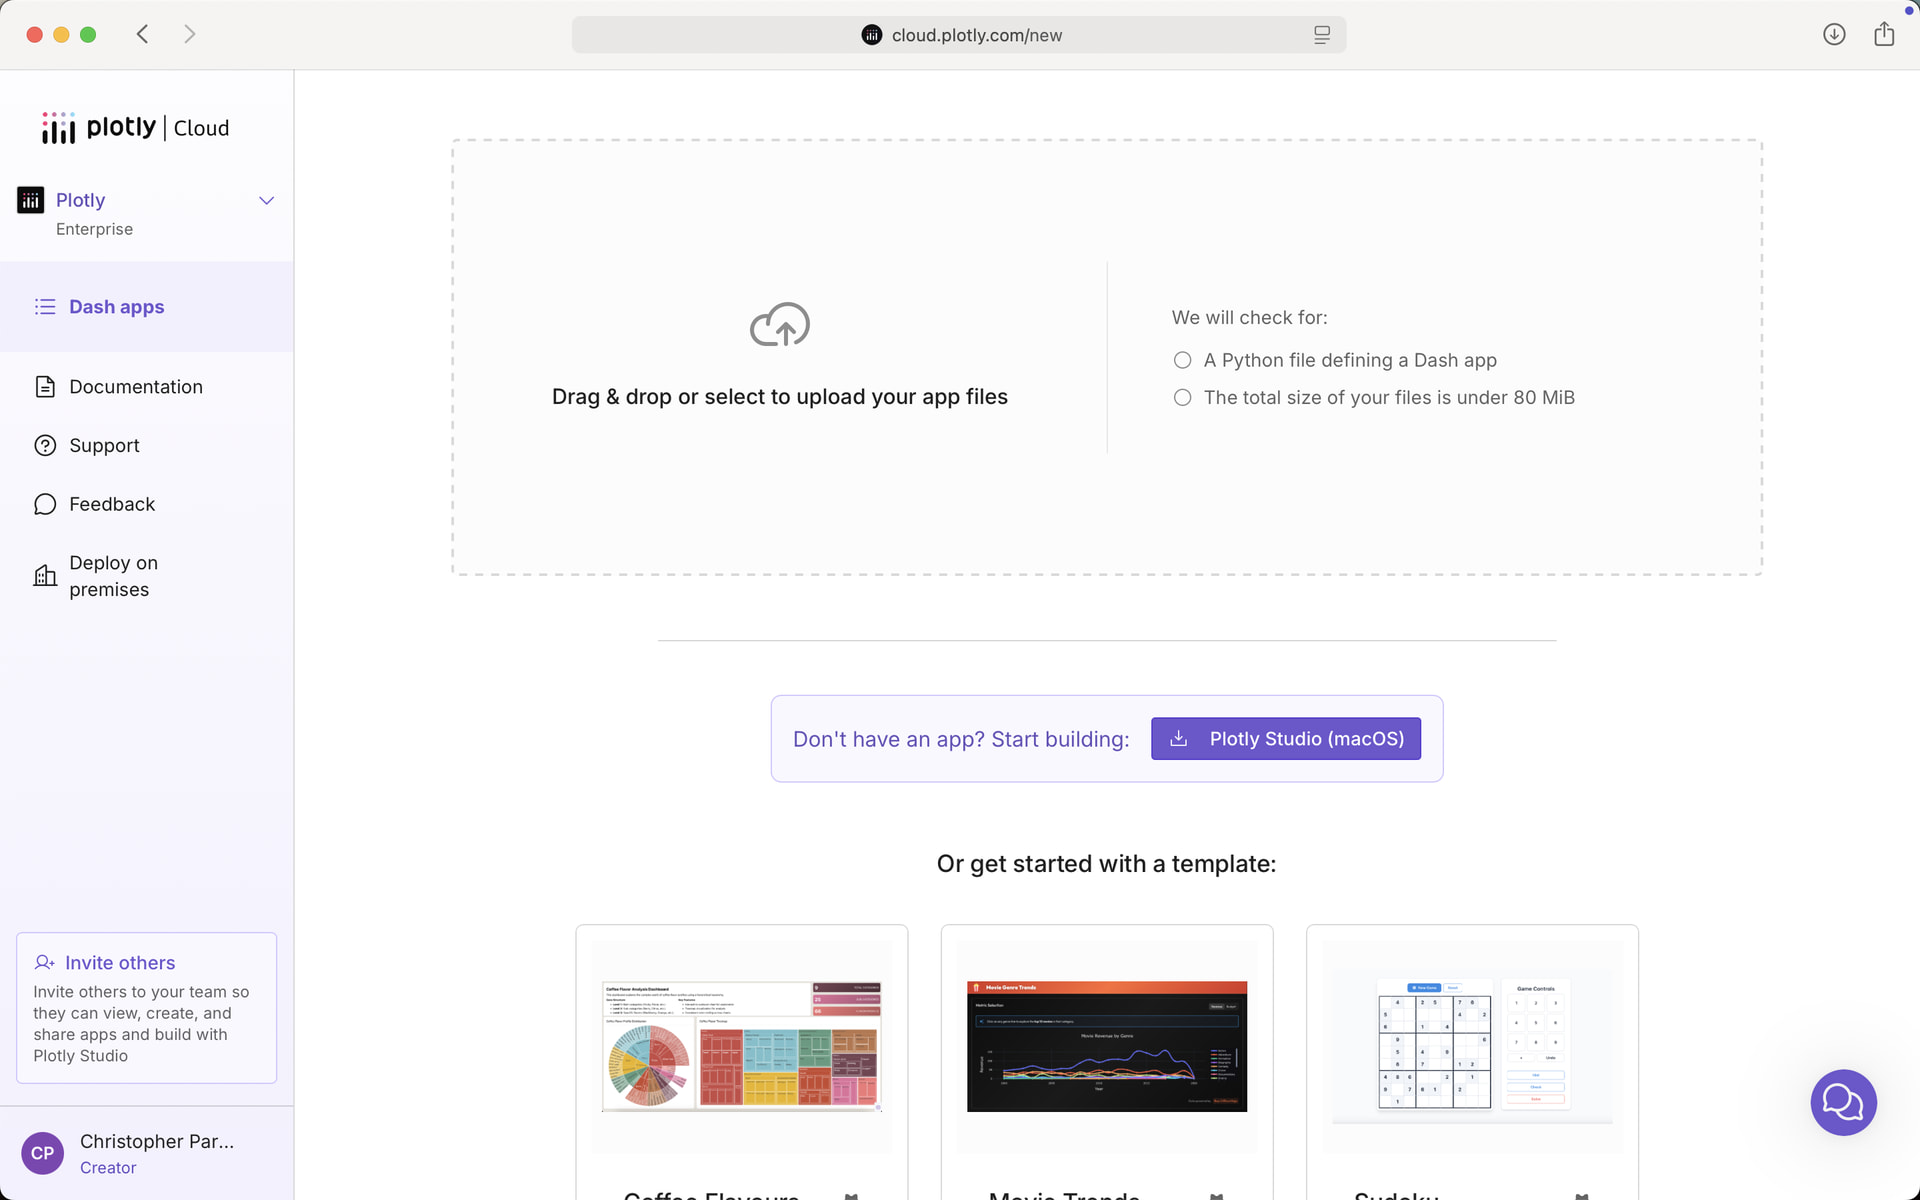
Option B: Upload your files to Plotly Cloud directly
Option C: Click the publish button in Dash Dev Tools

Option D: Click the Publish button in Plotly Studio (if that’s where you made the app)
Step 3. Turn on the AI chatbot in your app settings
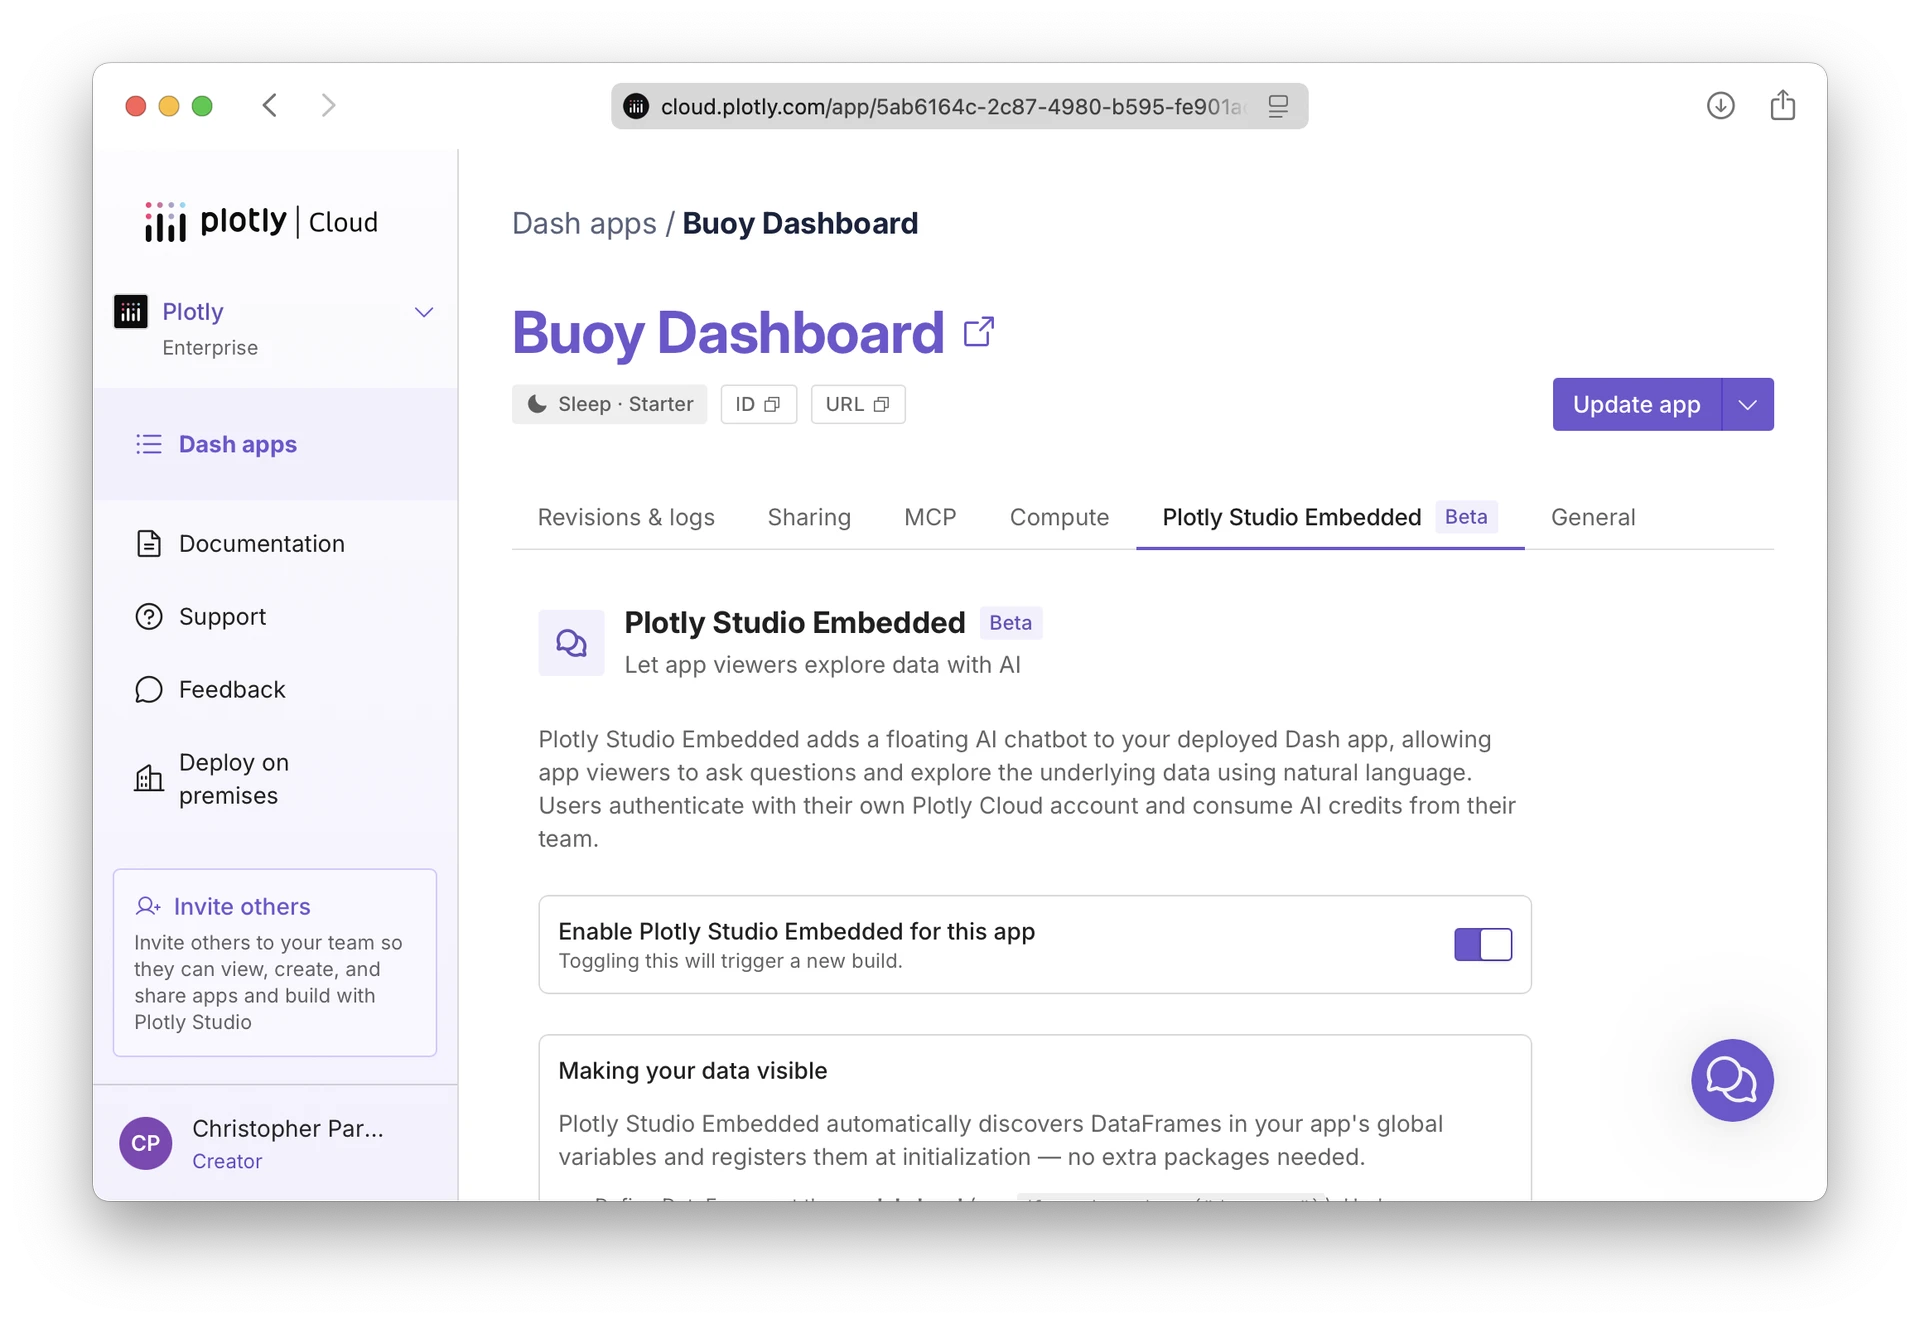
In Plotly Cloud, navigate to your app settings at https://cloud.plotly.com/app/<your_app_id>/settings?tab=ai-chat and then click on the button “Enable Plotly Studio Embedded”. This will automatically turn on the AI chatbot on your Dash app and allow your end viewers to chat with your app’s data and make graphs with AI.
And that’s it!
Now you and your viewers can chat with your data and use AI to make graphs.

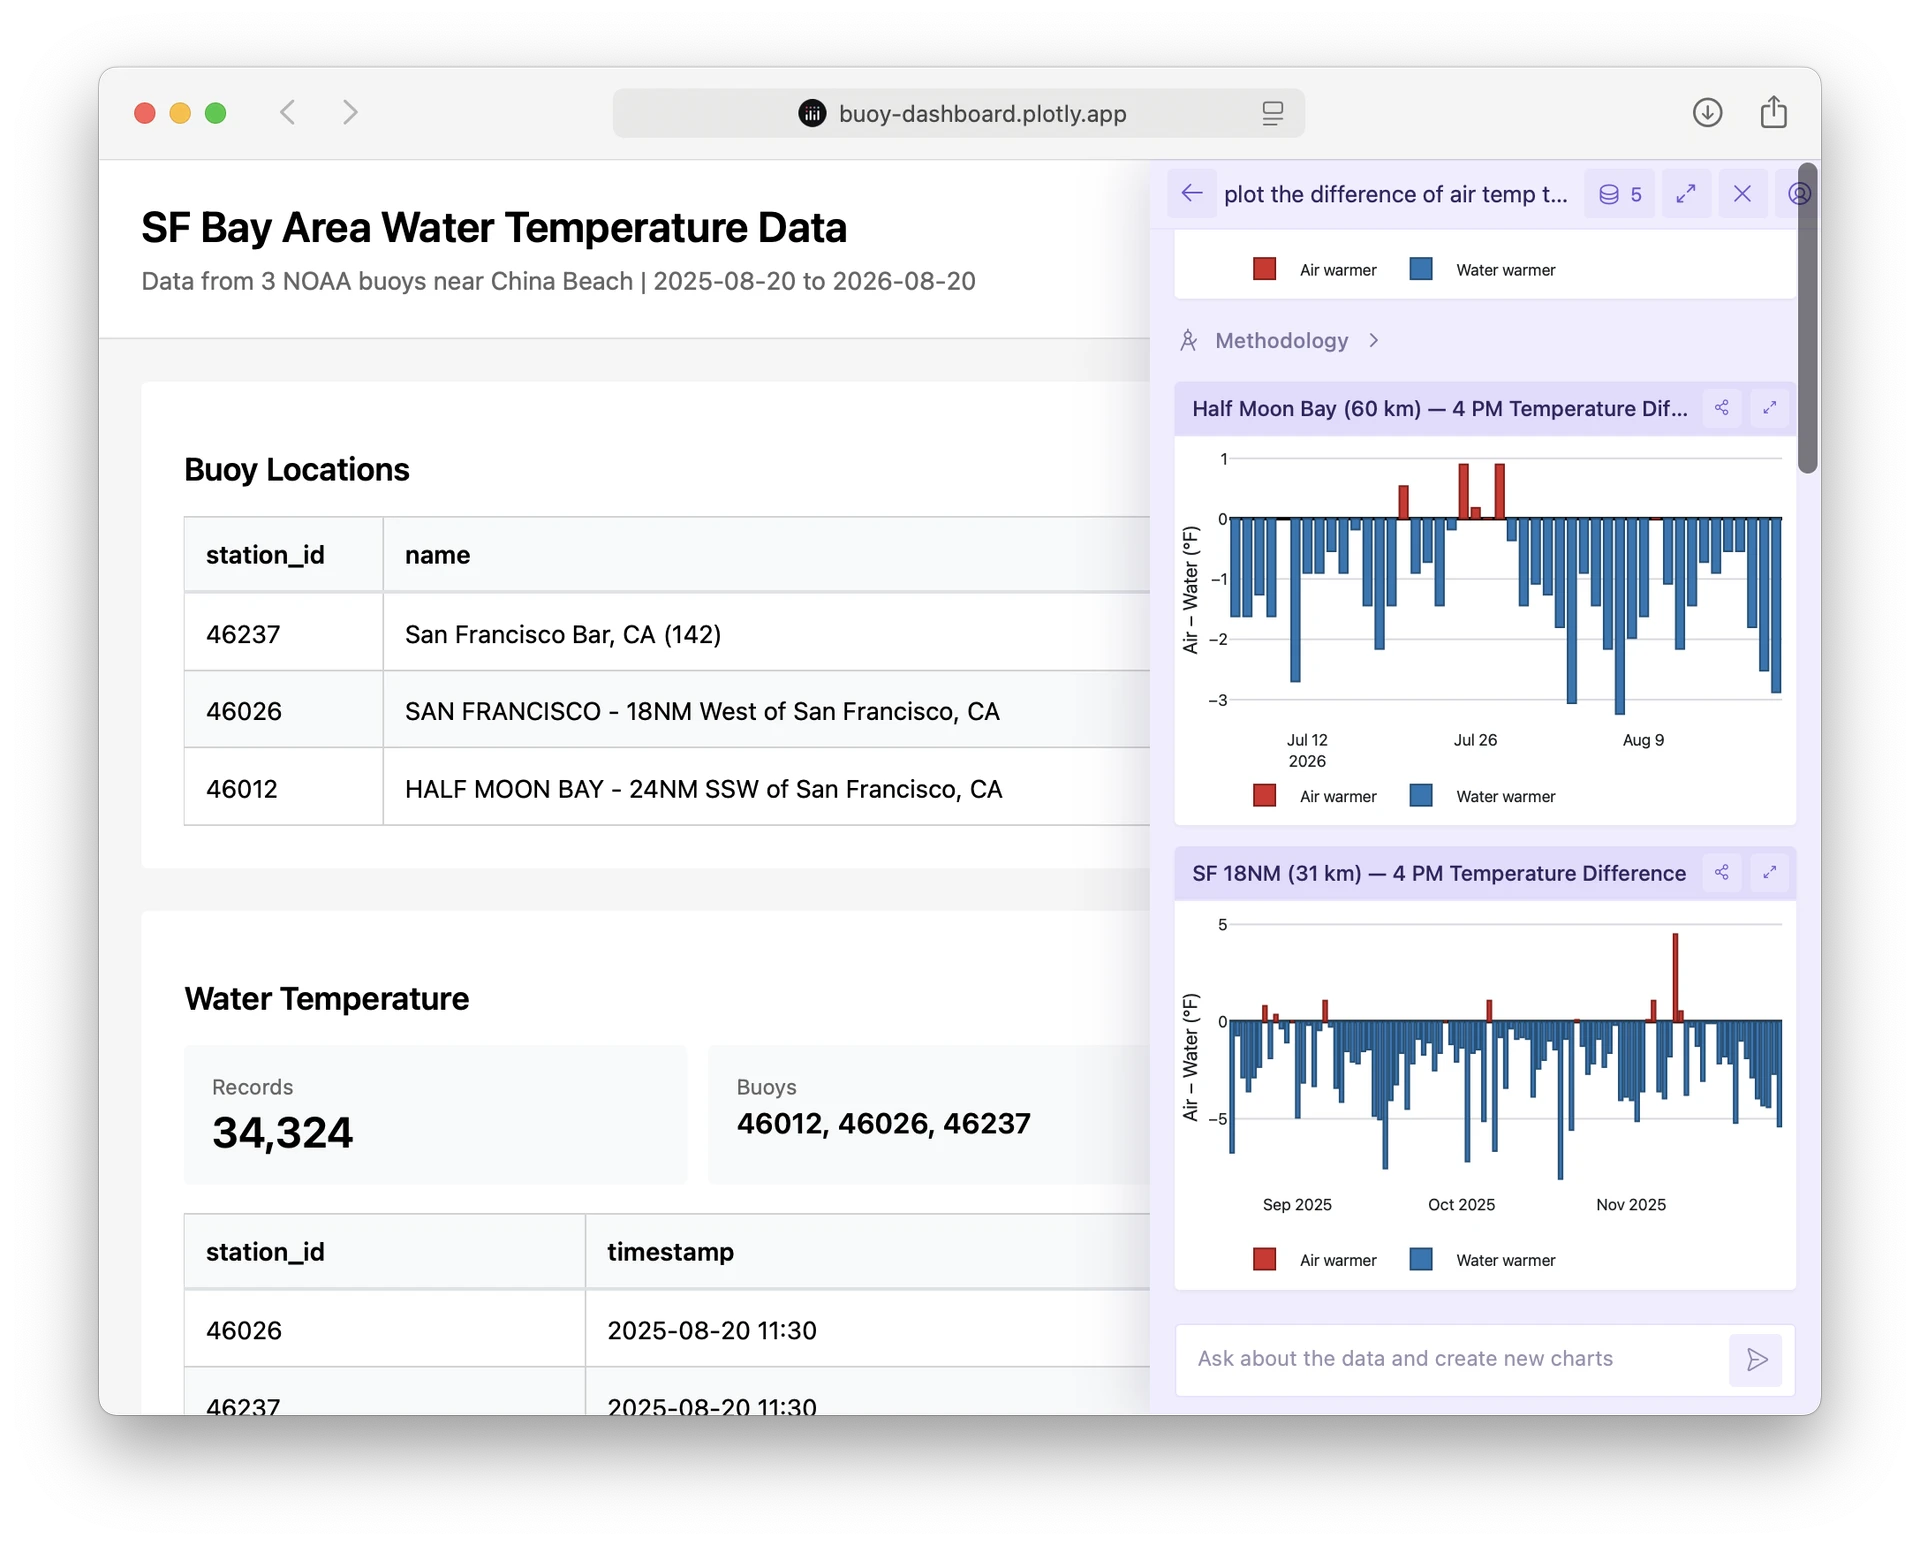
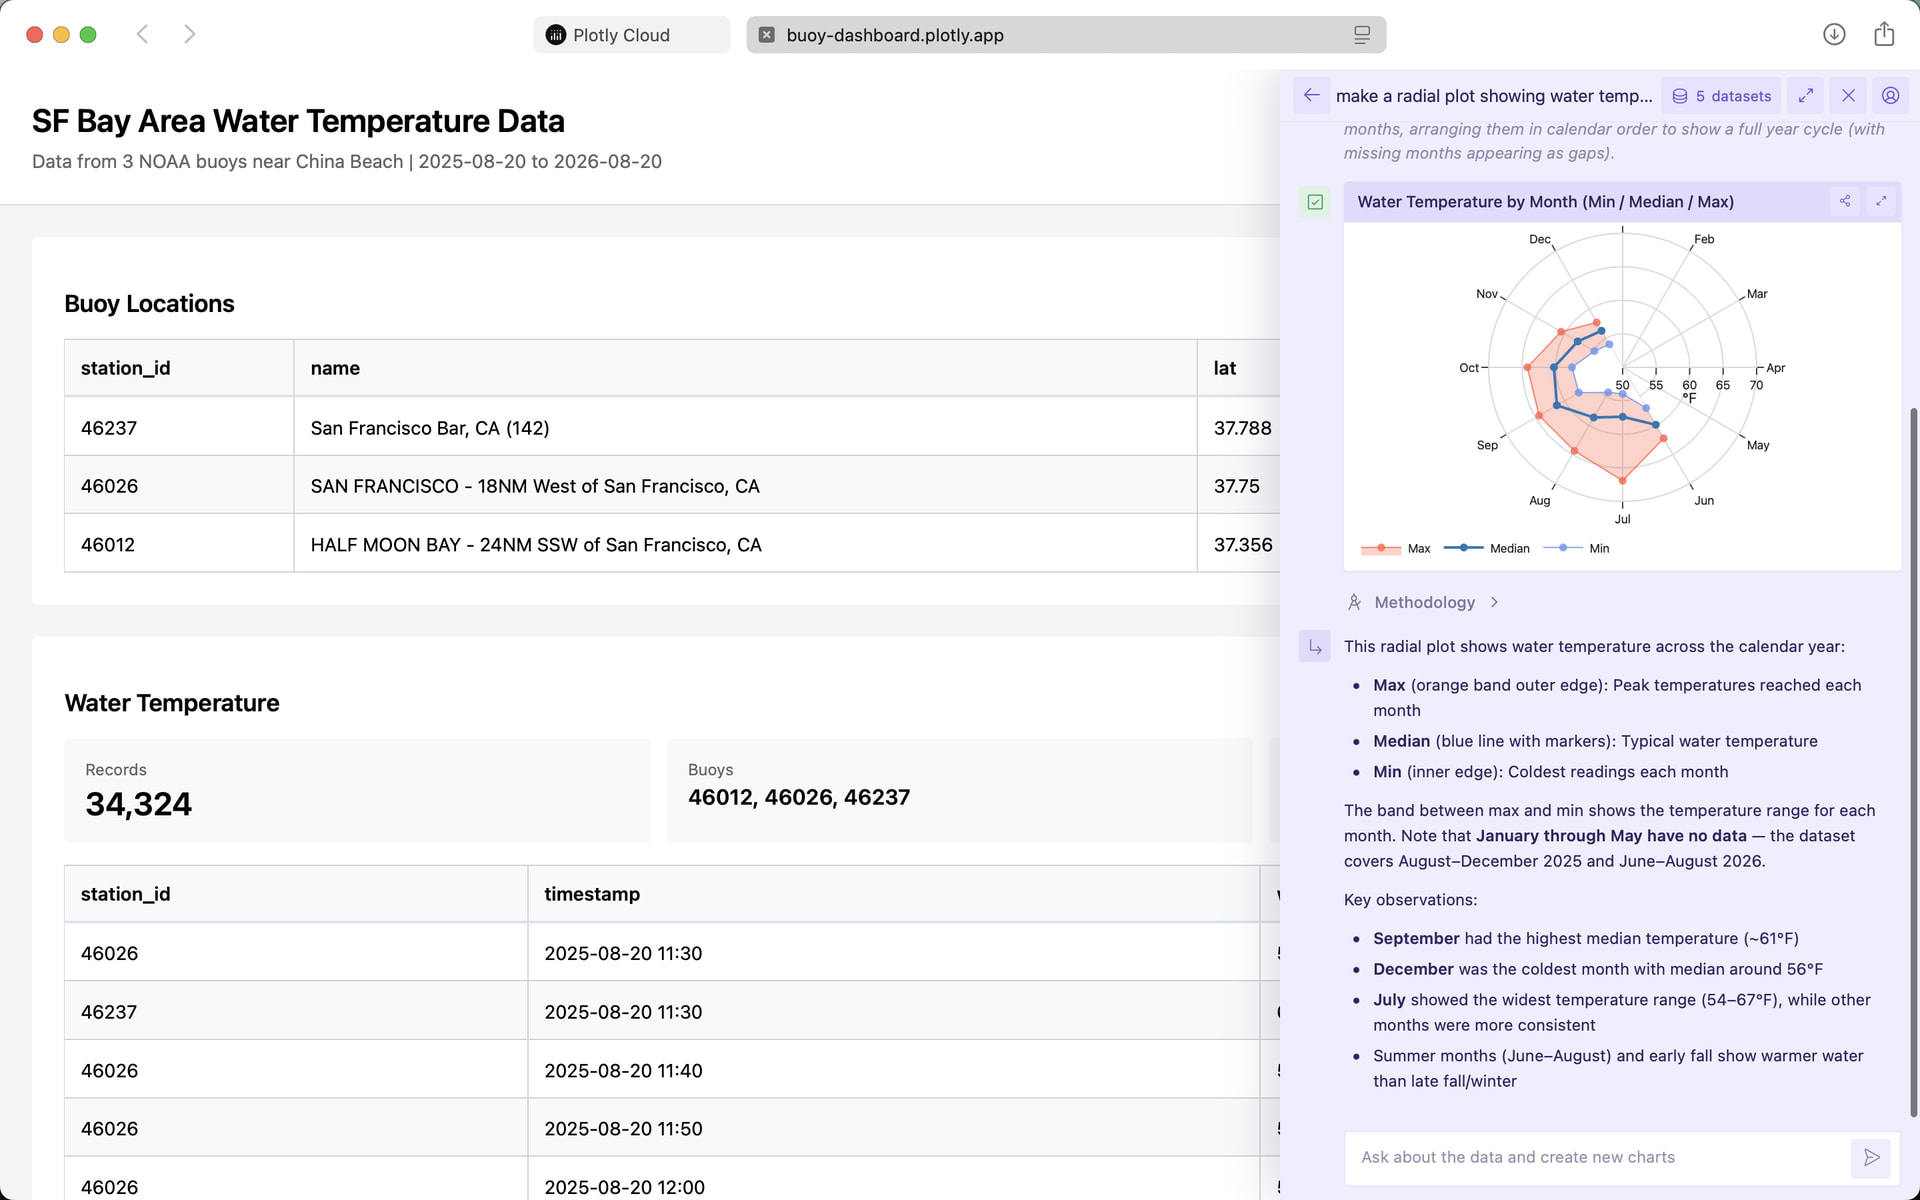
It’s agentic, so it it’ll perform agentic analytics in multi steps if needed before responding: querying the data, troubleshooting, generating charts, fixing them, etc.
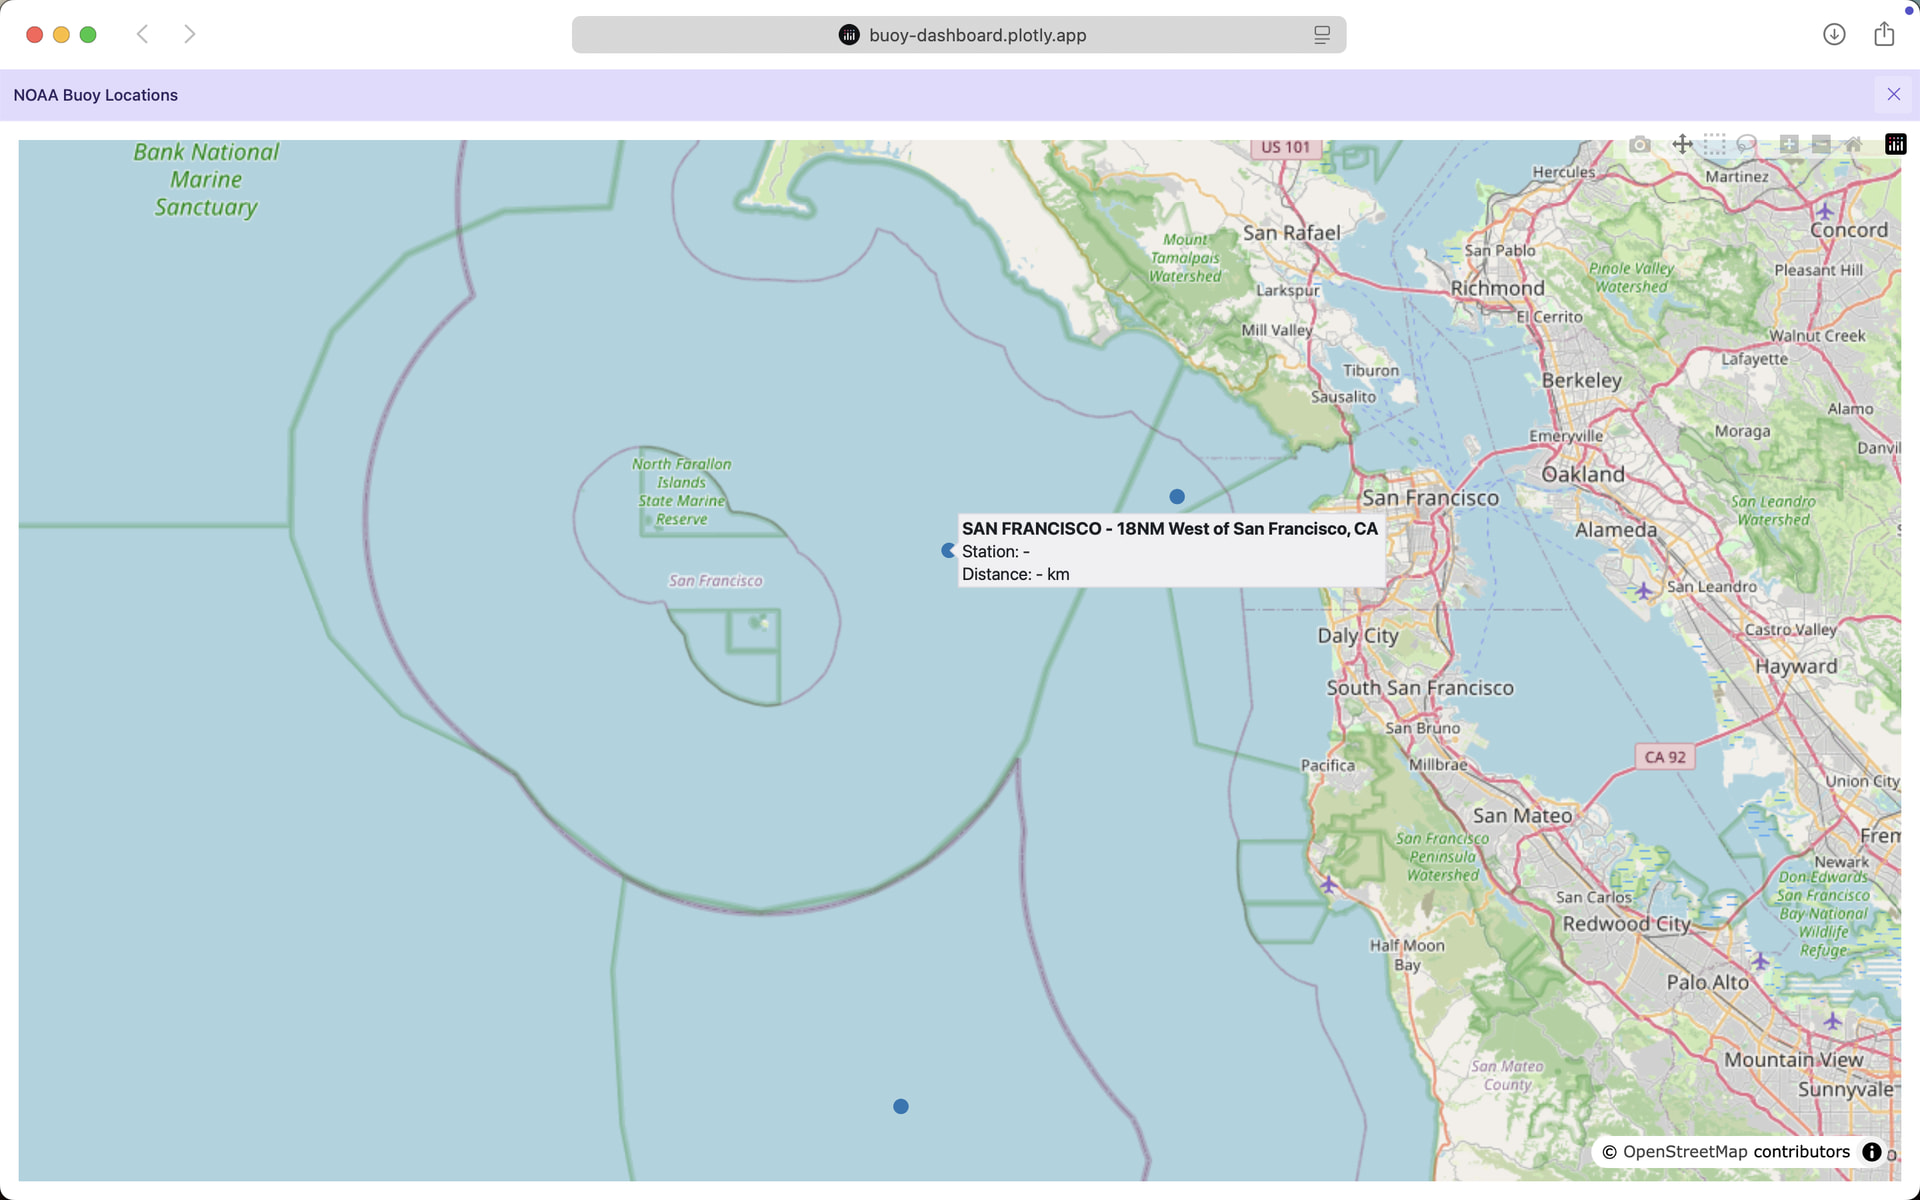
By default the Chat UI floats on top of the Dash app, but it can also go full screen:
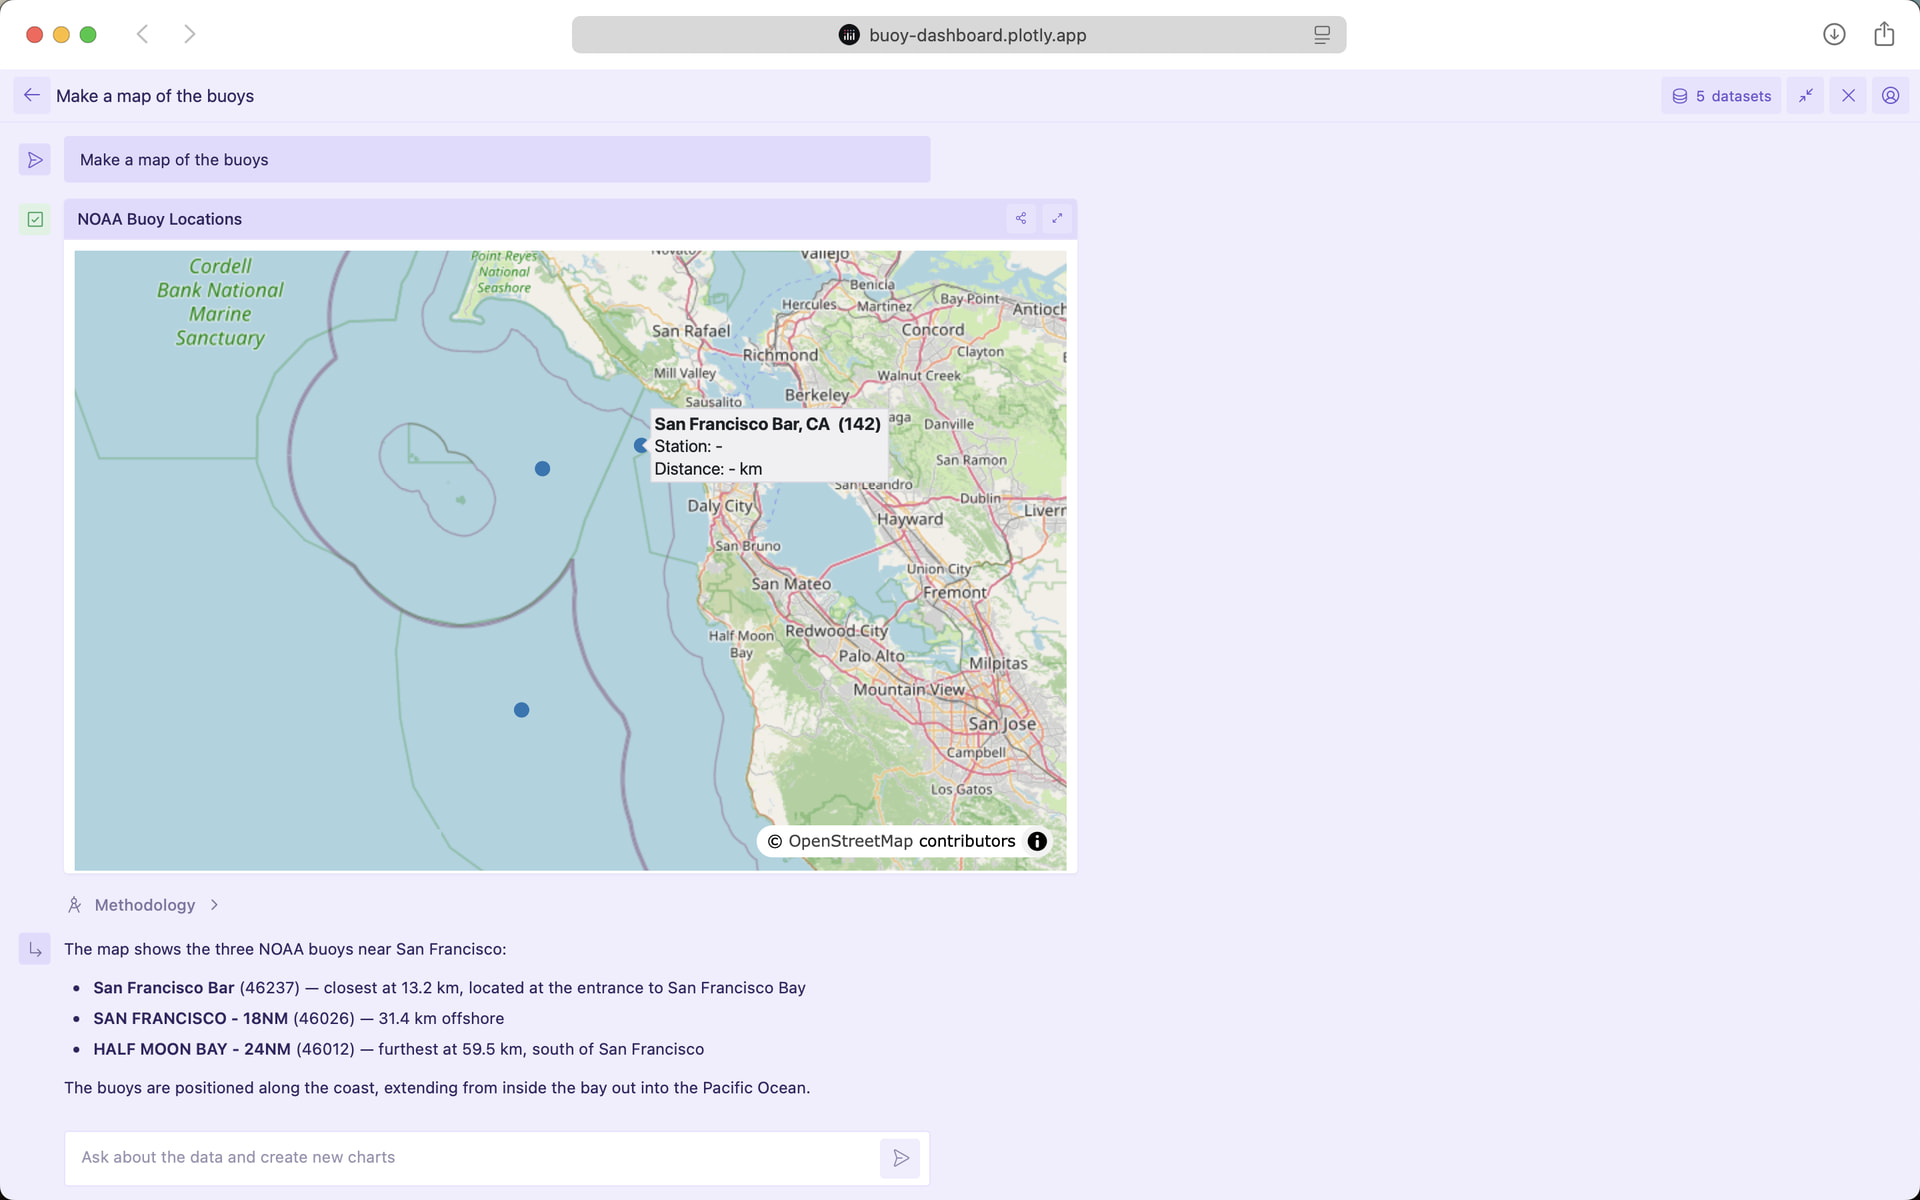
My favorite part of Plotly Studio Embedded is that Dash App viewers don’t need to do anything to get started.
All of the configuration is done in advance with a simple get_data() function. Data access is preconfigured and fully locked down which makes it very easy to roll out. This is a lot easier than setting up connectors, MCP servers, skills, managing credentials etc.
And it gives you a lot of control over how you want to expose the data to your end users. You can tweak the data in between your database and the end users - remove tables that aren’t relevant, rename columns to be more clear, explain semantic meanings in your docstring (which the AI is aware of), compute additional metrics, etc.
Plus, you can mix and match the AI experience with predefined views on the underlying Dash app. This can help you save cost in token$$ by having the majority of the questions be answered in your Dash app, and reserve the AI for the long tail of questions that the app leaves unanswered.