Hello! I would like to submit this Bioinformatics and Life Sciences app:
Immune Health Atlas UMAP Explorer from the Allen Institute for Immunology
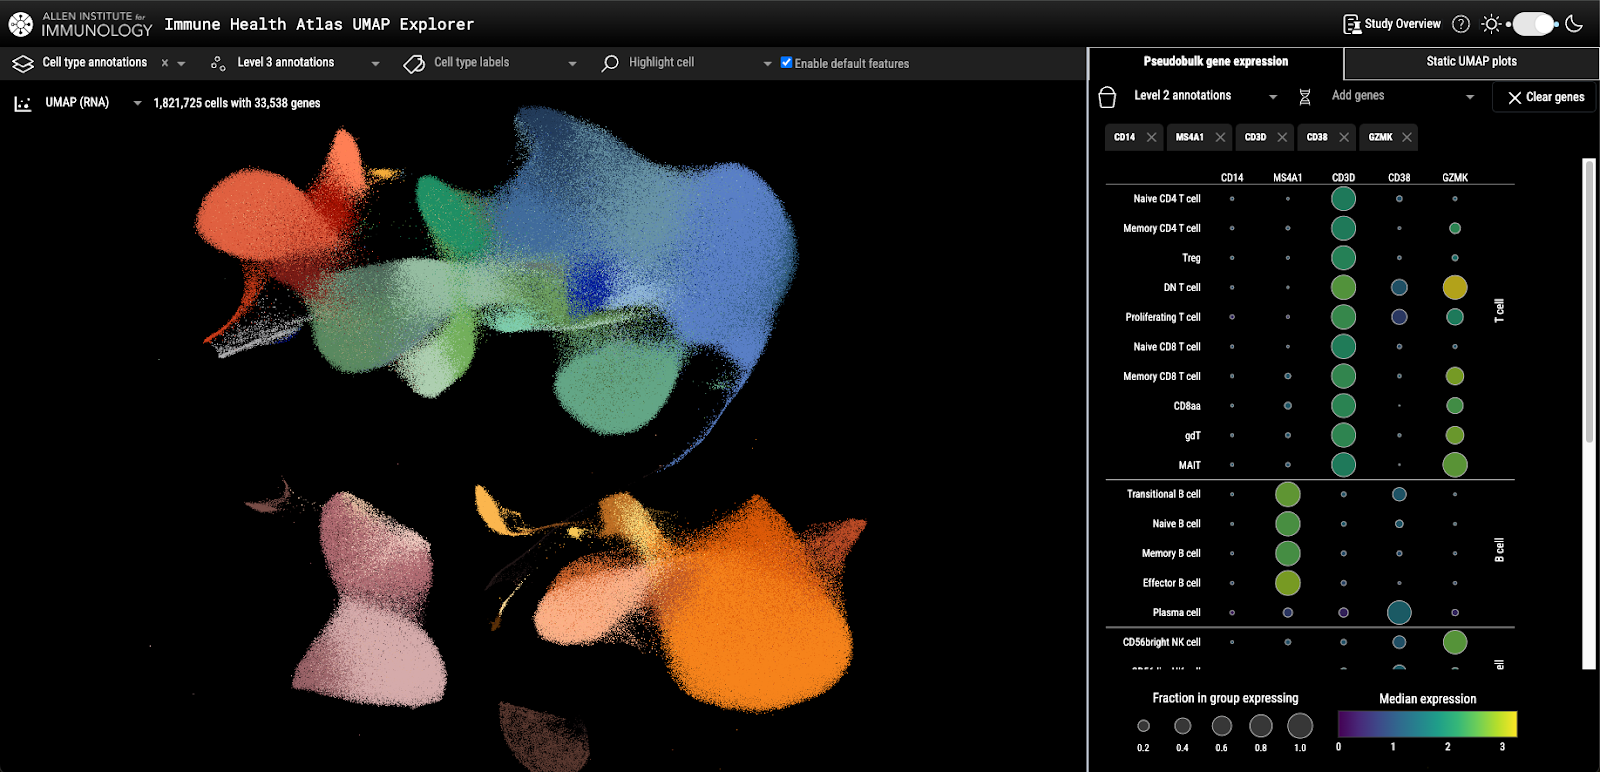
This Dash app lets users explore single-cell RNA sequencing data from 108 study participants of varying age groups, providing a snapshot of the immune system at different ages in 71 different immune cell types. The dataset consists of over 1.8 million individual cells, each with 33,000+ genes, totaling over 59 billion data points.
Dimensionality reduction techniques common in bioinformatics were utilized to visualize these data. This includes a UMAP (Uniform Manifold Approximation and Projection) scatter plot, where:
- Each dot represents a single cell, positioned based on its similarity to other cells.
- Users can color the plot by categories (like cell type or participant metadata) or continuous values (such as gene expression levels).
For a broader view of different immune cell types, the app includes a “pseudobulk” gene expression dot plot:
- It shows median gene expression for each cell type at 3 cell type “resolutions” (levels 1, 2, and 3).
- It also highlights what fraction of cells in each type express a given gene.
The following key packages were used to handle and visualize all the data:
- Zarr – cloud-optimized chunked arrays for fast, scalable access to large datasets.
- dash-deck – Dash component based on deck.gl, a high-performance visualization tool powered by WebGL, enabling smooth, real-time rendering of over 1.8 million points at once.
Thank you!
Christian