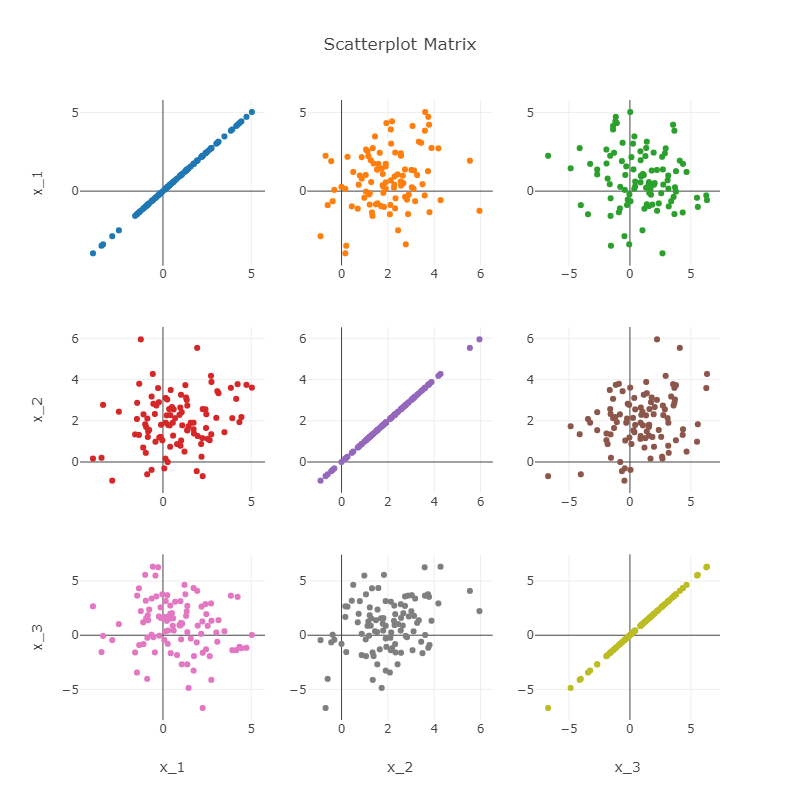
So for the code below i made my own scatterplot matrix-ish with just matplotlib before i found plotly. So while changing it over to plotly I found that I was not getting the same results for my plot (matplotlib) and plot2 (plotly) matrices. For some reason the plotly one was taking every scatterplot and showing it twice.I have images posted below of how they showed up. Like even x_2 and x_2 should be a straight line but it its not. That line finally appears after all of the repetition at x_3 x x_3.
I was wondering if anyone has had this issue or if they know how to fix it?
import matplotlib.pyplot as plt

import plotly.offline as py
import plotly.figure_factory as ff

import numpy as np
import pandas as pd

def generate(mean, cov, num):
    re = list()
    for i in range(num):
        re.append(np.random.multivariate_normal(mean, cov).T)
    return re

def plot(vectors):
    x_ = [[] for x in range(len(vectors[0]))]
    for v in vectors:
        for i in range(0, len(v)):
            x_[i].append(v[i])

    for i in range(0, len(x_)):
        for j in range(0, len(x_)):
            #if i == j: continue
            plt.ylabel('x_' + str(j))
            plt.xlabel('x_' + str(i))
            plt.plot(x_[i], x_[j], 'ro')
            plt.savefig('./img/2/{}x{}.png'.format(i,j), bbox_inches='tight')
            plt.close()

def plot2(data):
    df = pd.DataFrame(data, columns=['x_1', 'x_2', 'x_3'])
    fig = ff.create_scatterplotmatrix(df, height=1200, width=1200,
                                      marker = dict(
                                          opacity = .5,
                                          ),
                                      )
    py.plot(fig, filename='2.html')


numVectors = 100
mean = np.array([1, 2, 1])
cov = ([[4,      .8,  -.3],
        [0.8,    2,   .6],
        [-.3,    .6,  5]])

gen_vec = generate(mean, cov, numVectors)
plot(gen_vec)
plot2(gen_vec)
Hey @trwinowiecki,
Your gen_vec doesn’t have the shape (numVectors,3). That is why the scatterplot matrix does not work well. gen_vec = np.random.multivariate_normal(mean, cov, numVectors) does the job, i.e define all vectors at once, not one at a time, as you did:
Thank you very much for your reply but unfortunately after making those changes the matrix still doubled each graph for some reason. The new code is below. I was wondering if it was possible that it was the plotly module but uninstalling and reinstalling did nothing. I was able to do another scatterplot matrix properly for something else but it won’t work for this particular program.
import matplotlib.pyplot as plt

import plotly.offline as py
import plotly.figure_factory as ff

import numpy as np
import pandas as pd

def plot(vectors):
    x_ = [[] for x in range(len(vectors[0]))]
    for v in vectors:
        for i in range(0, len(v)):
            x_[i].append(v[i])

    for i in range(0, len(x_)):
        for j in range(0, len(x_)):
            #if i == j: continue
            plt.ylabel('x_' + str(j))
            plt.xlabel('x_' + str(i))
            plt.plot(x_[i], x_[j], 'ro')
            plt.savefig('./img/2/{}x{}.png'.format(i,j), bbox_inches='tight')
            plt.close()

def plot2(data):
    df = pd.DataFrame(data, columns=['x_1', 'x_2', 'x_3'])
    fig = ff.create_scatterplotmatrix(df, height=1200, width=1200,
                                      marker = dict(
                                          opacity = .5,
                                          ),
                                      )
    py.plot(fig, filename='2.html')


numVectors = 100
mean = np.array([1, 2, 1])
cov = np.array([[4,      .8,  -.3],
                [0.8,    2,   .6],
                [-.3,    .6,  5]])

gen_vec = np.random.multivariate_normal(mean, cov, numVectors)
#plot(gen_vec)
plot2(gen_vec)
Here is my code that plots the scatter matrix: http://nbviewer.jupyter.org/gist/empet/5222ef7f066d814a3514611b9f238987
Hence from the Plotly part all is OK.
Perhaps your mixture of matplotlib and Plotly functions leads to a strange scatterplot matrix.
Try to change the function names plot, and the parameter data.
So after messing around with the code and removing parts of it, it was all because of the marker = dict( opacity = .5 ) part. I tried reformatting it so it was all on one line but it still repeated the graphs. After getting rid of that piece though it works how it should. It seems that because I don’t have an index it messes with how marker works. Even just changing the symbol there does not work. Thank you for all of your help!