Hi Guys
let me apologize in advance because i have no reproducible code because this problem only persists with my data set but its not a problem of the data set as can be crosschecked by using Matplotlib.
def figure_change_point(selection):

    fig = make_subplots(shared_xaxes=True,rows=5,cols=1)
    f,ax = plt.subplots(5,1,figsize=(20,10))
    Mask = np.load("Files\mask.npy")
    HDU = fits.open("HDU.fits")
    Curve_Names = ["PSF_FLUX_COR","AP1_FLUX_COR","AP2_FLUX_COR","AP3_FLUX_COR","AP4_FLUX_COR"]


    i = 0
    for ID in Curve_Names:

        Flux = HDU[1].data[ID]
        Time = HDU[1].data["Time"]

        plot = go.Scatter(x = Time[Mask],y = Flux[Mask],mode="markers",name=ID)
        fig.add_trace(plot,col=1,row=i+1)
        ax[i].plot(Time[Mask],Flux[Mask],".")
        i +=1

    fig.update_layout(height=1500, title_text="Data Explorer")

        #for s in selection:
        #    fig.add_vline(x=Time[s])
    plt.close()
    return f,fig


f,fig = figure_change_point([40,500,900])
fig
This is the Code Snippet that causes me a headache the nearly exact same code snippet worked in a previous code cell of my Jupyter notebook before.
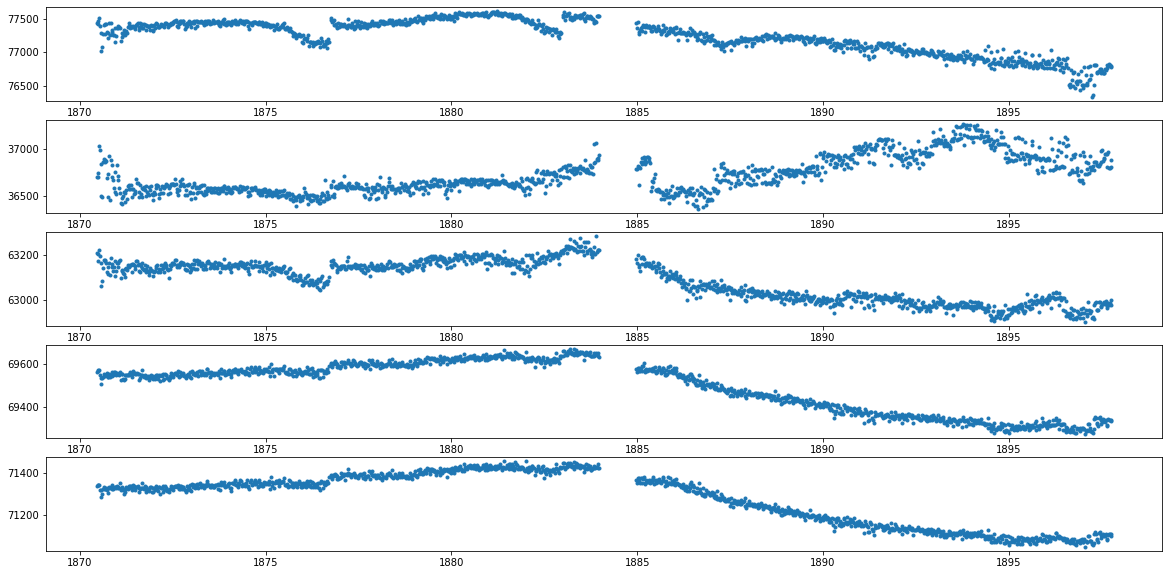
This produces the following figure
Which is not what i am expecting what i am expecting works with the exact same dataset with matplotlib perfectly and this is what its supposed to show:
has anyone ever encountered such a problem I couldnt find anything so far. Its not reproducible and the data does also not show this behaviour. Have i overseen something obvious?
Hope someone here can help me.
it obviously has something to do with the datetime format that your data has. It may need some conversion before you send it to the scatter build function.
So while the Datatype of the Datetime is just standard python f8 but when i wrap it into a numpy array where i change it to a different datatype for both Flux and Time then it works.
I dont understand why it doesnt work especially considering the fact that it worked before in different plots with plotly and it also works exactly as expected without changing anything when using plotly express.
So thanks for giving me an idea how to fix it. But the problem doesn’t make sense to me too my understanding there should be no problem
So 3 things:
The thing you sent helps partially but only for the x axis the problem persists on the y axis and obviously it slows it down because pure python lists. Time is basically a ndarray from numpy
This is what i get for a representation of the object:
and 3rdly i found out by doing one of the two things that are different in the previous part where it worked i ran it as part of a dash app and then it displays the correct expected results
So now i am realy confused as to what causes this problem and how running this in dash just changes it back to working. It solves my problem in so far as i want to run everything on dash anyways, but its still extremely confusing.
I have an idea. is it possible that Plotly doesnt like handling either “>f8” or “<f8” dtype? Because thats the one reason i could think of. But i cant find this noted anywhere.