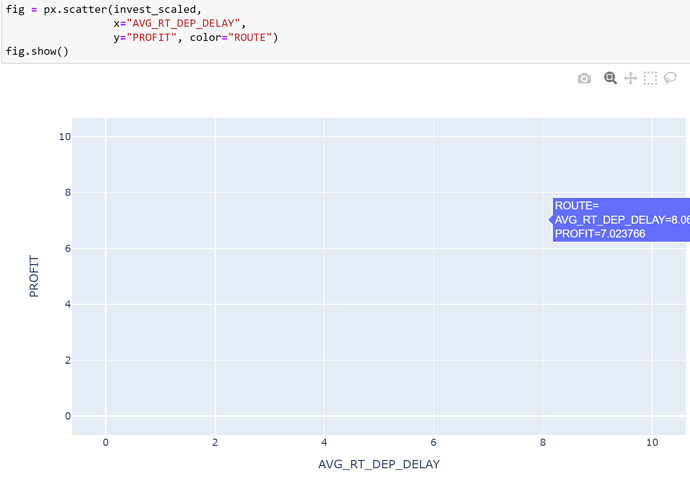
I can see the info for each point, but the points are invisible.
Hi @claratt and welcome to the forums.
I assume invest_scaled is a pandas.DataFrame and the rest of the arguments are the respective column names.
Did you check the data type of your columns?
Yes, x and y are both float64
Did you try plotting with different data such as px.data.iris()?
Yes, this dataset works.
OK, could you share an extract of your data? Otherwise it will be quite difficult to find a solution.
Sure, but where to upload the file?
