Scatter marker symbol not displaying correctly

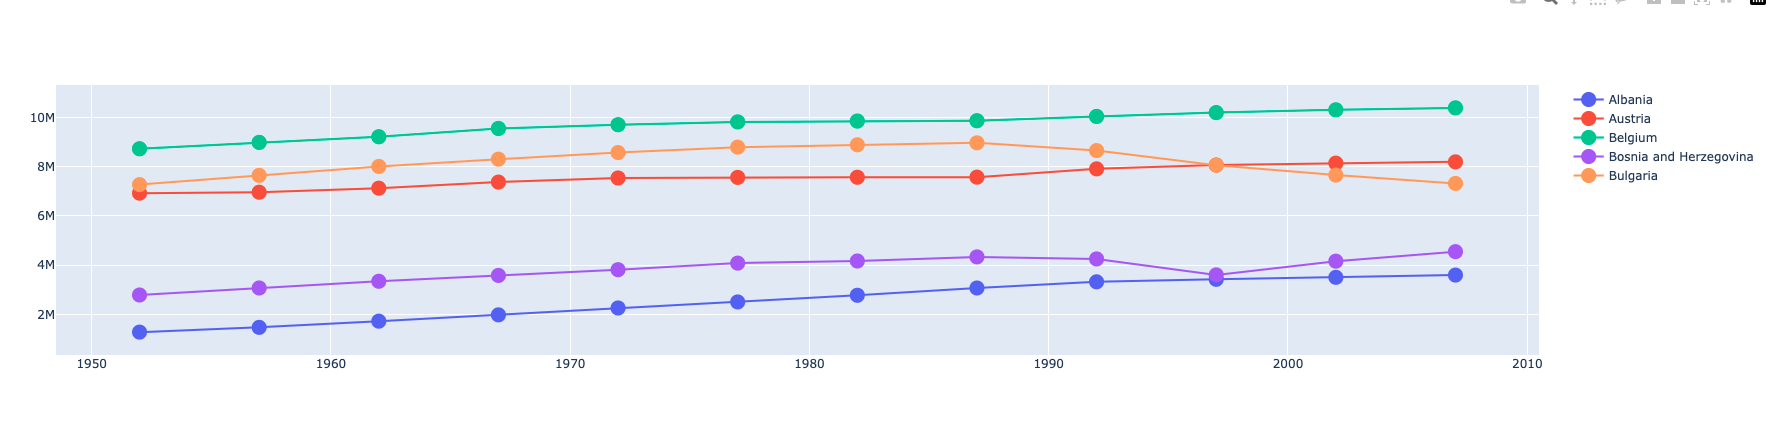
I am trying to reproduce a block of code from one of the examples listed here. The example shows usage of arrow markers with a go.Scatter object as follows:

import pandas as pd
import plotly.express as px
import plotly.graph_objects as go

df = px.data.gapminder()

fig = go.Figure()

for x in df.loc[df.continent.isin(["Europe"])].country.unique()[:5]:
    fil = df.loc[(df.country.str.contains(x))]
    fig.add_trace(
        go.Scatter(
            x=fil["year"],
            y=fil["pop"],
            mode="lines+markers",
            marker=dict(
                symbol="arrow",
                size=15,
                angleref="previous",
            ),
            name=x,
        )
    )
fig.show()

I’m able to run the code, but the arrow symbol does not display correctly. The marker argument applies all of the given marker parameters except for symbol='arrow'. The result produces dots and not arrows as shown below. If I change to symbol=arrow-up`, it works correctly and I am able to see arrows.

I’m running plotly 5.13.0. Any help is appreciated.

Hi @jacobsgomez welcome to the forums.

I can’t reproduce this behaviour (also running plotly 5.13.0):

EDIT: I tried also with several traces added in a for loop, still works.

import plotly.graph_objects as go

fig = go.Figure()

fig.add_trace(
    go.Scatter(
        x=[1,2,1,5,3],
        y=[1,2,3,4,5],
        mode="lines+markers",
        marker=dict(
            symbol="arrow",
            size=15,
            angleref="previous",
        ),
    )
)
fig.show()

creates:

Hi AIMPED, thank you for attempting to reproduce my results. I’ve now isolated the behavior to only iPython Notebooks and the way they render the specific arrow symbol (Jupyter, VS Code, etc). The code produces the correct results when viewed as an HTML file in browser.

2 Likes

I also found the same issue when creating plots with marker=arrow + angle=... in Python notebooks; this affects both plotly express and standard plots created with go. But I can create plots with the much older markers arrow-up, etc.

Is there a fix for this problem?