Plotly Sankey charts are a really amazing chart to visualize flows between different places, nodes, or categories.
Here are a few tips and tricks I use when creating them in Plotly Studio.
I’m using two datasets in this example:
- This electric grid dataset taken from https://www.eia.gov/electricity/gridmonitor/dashboard/electric_overview/balancing_authority/PACE
- The sample delivery dataset included in Plotly Studio
Here’s the full prompt:
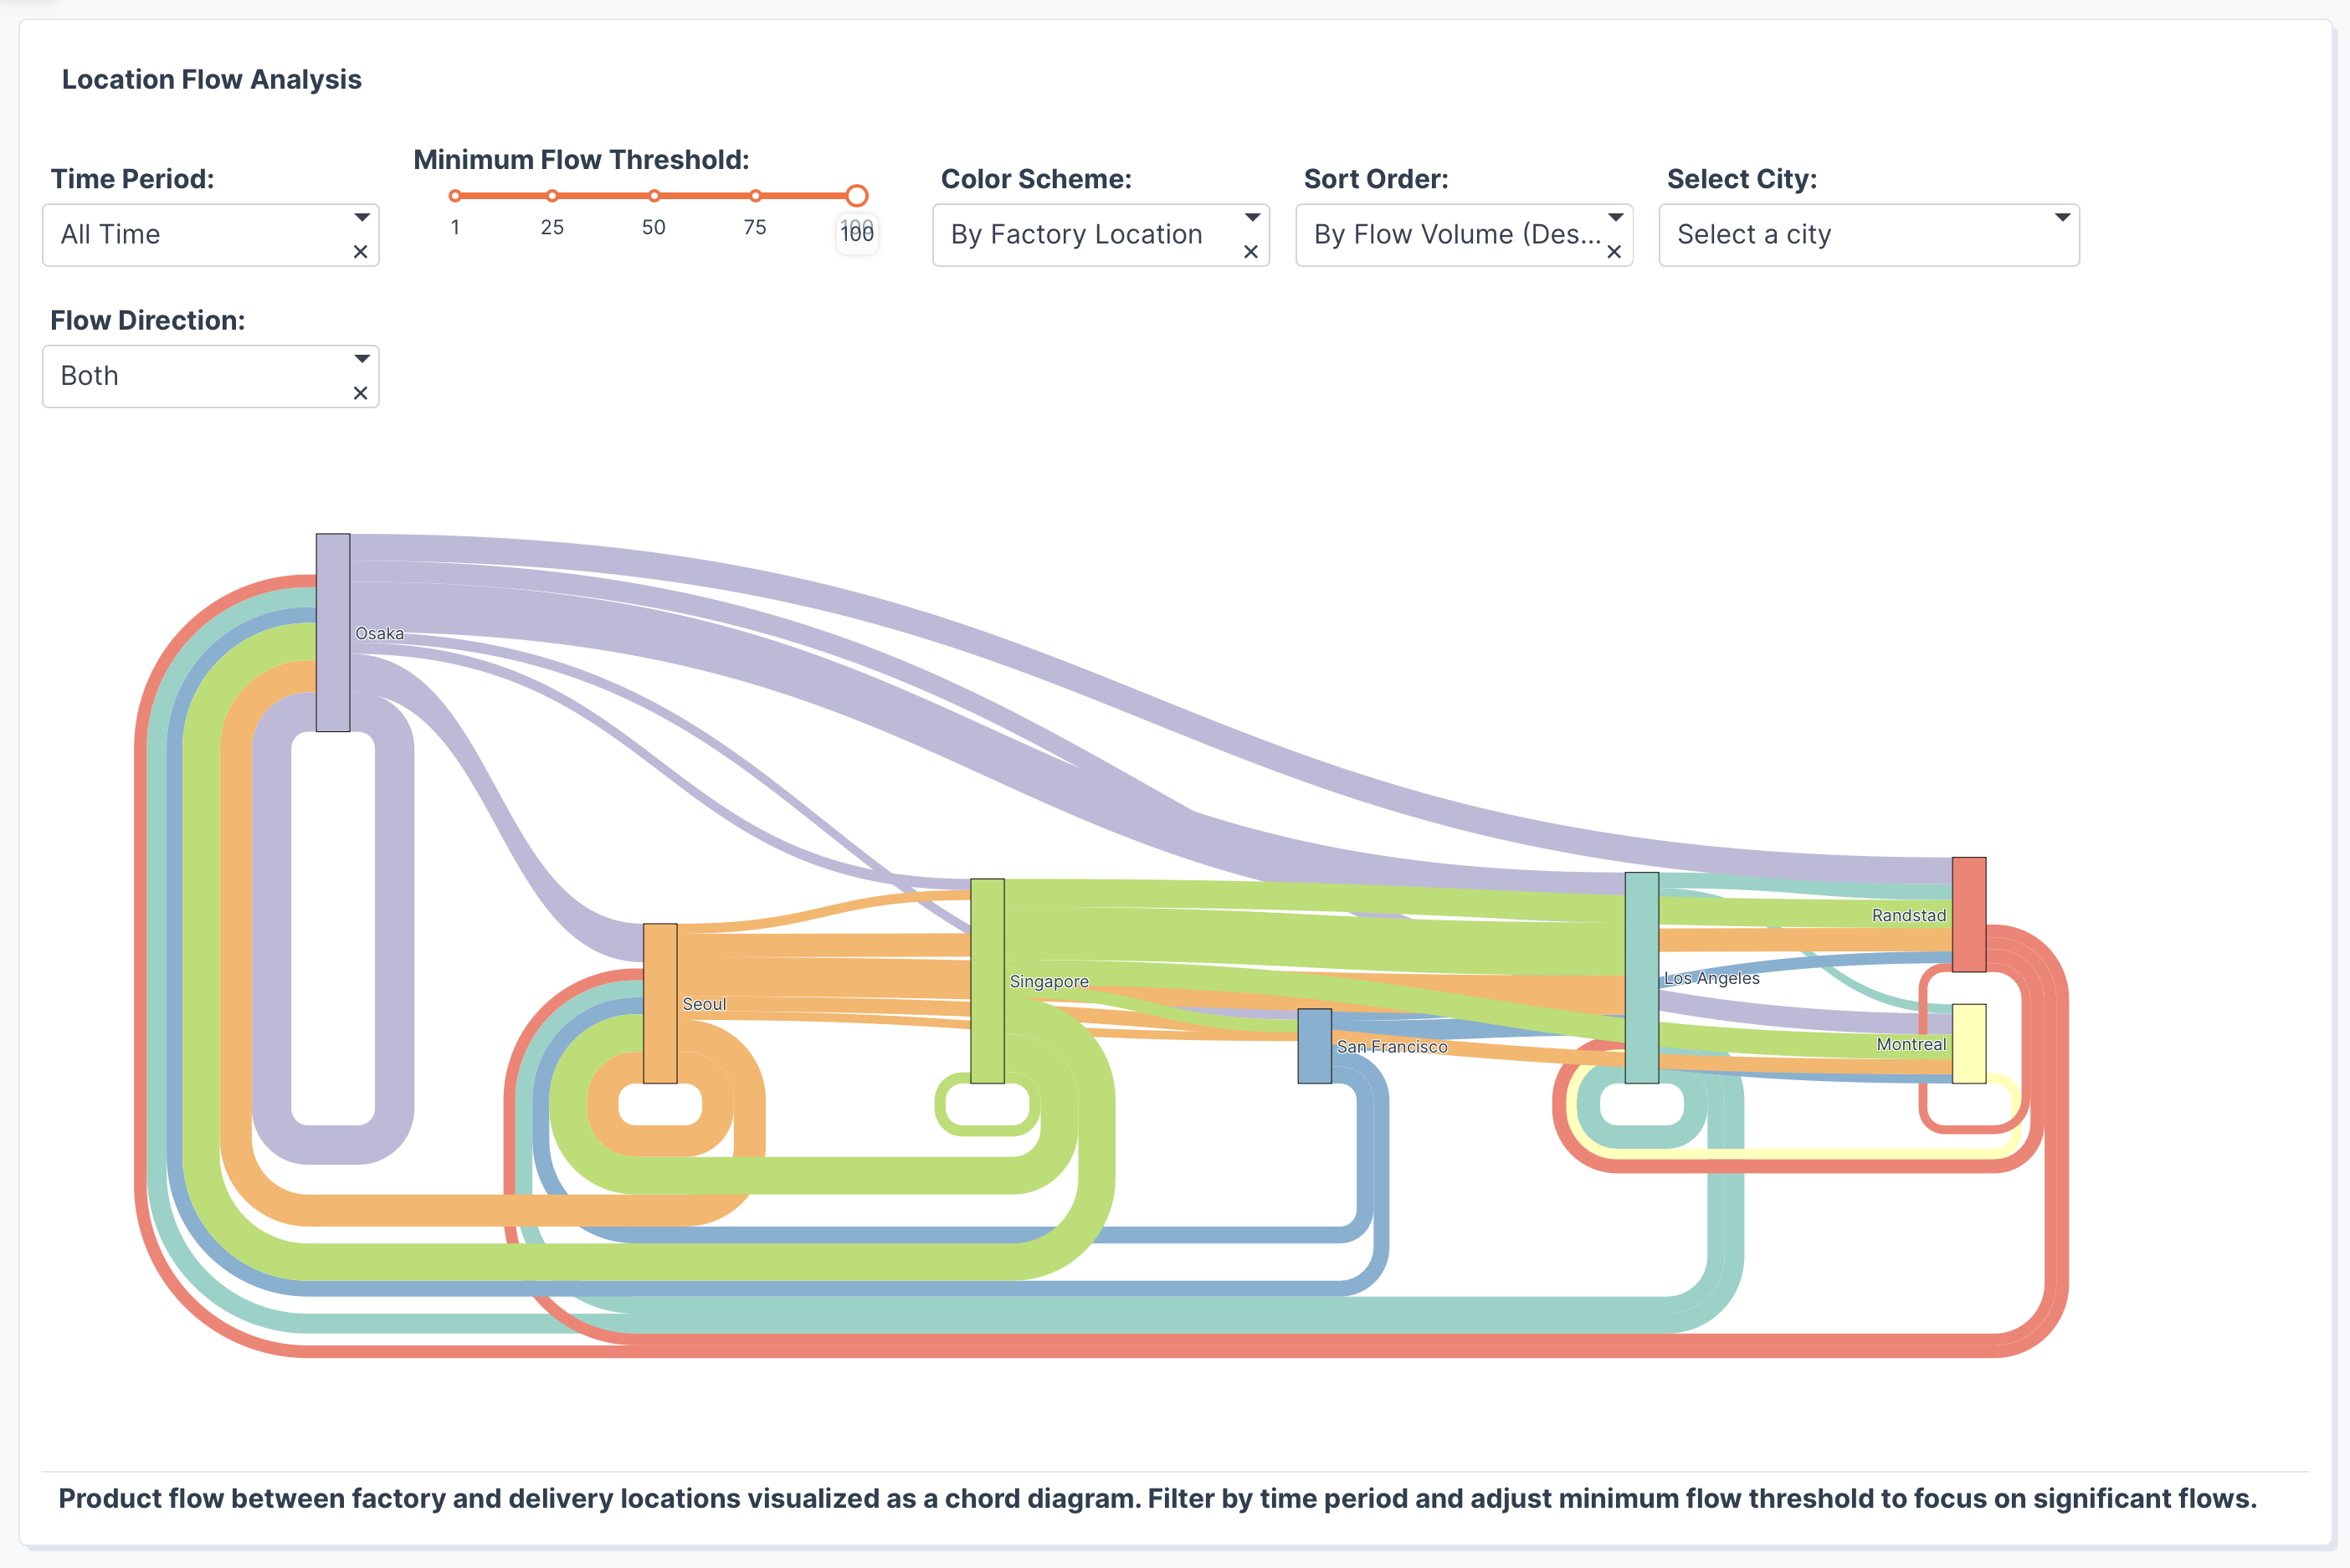
Product flow between factory and delivery locations as a chord diagram with dropdown to filter by specific time periods and slider to adjust minimum flow threshold.
Option to color the nodes and the links by factory location OR no color OR color by count (discrete bins)
Offer different sorting options to show different cities in different orders.
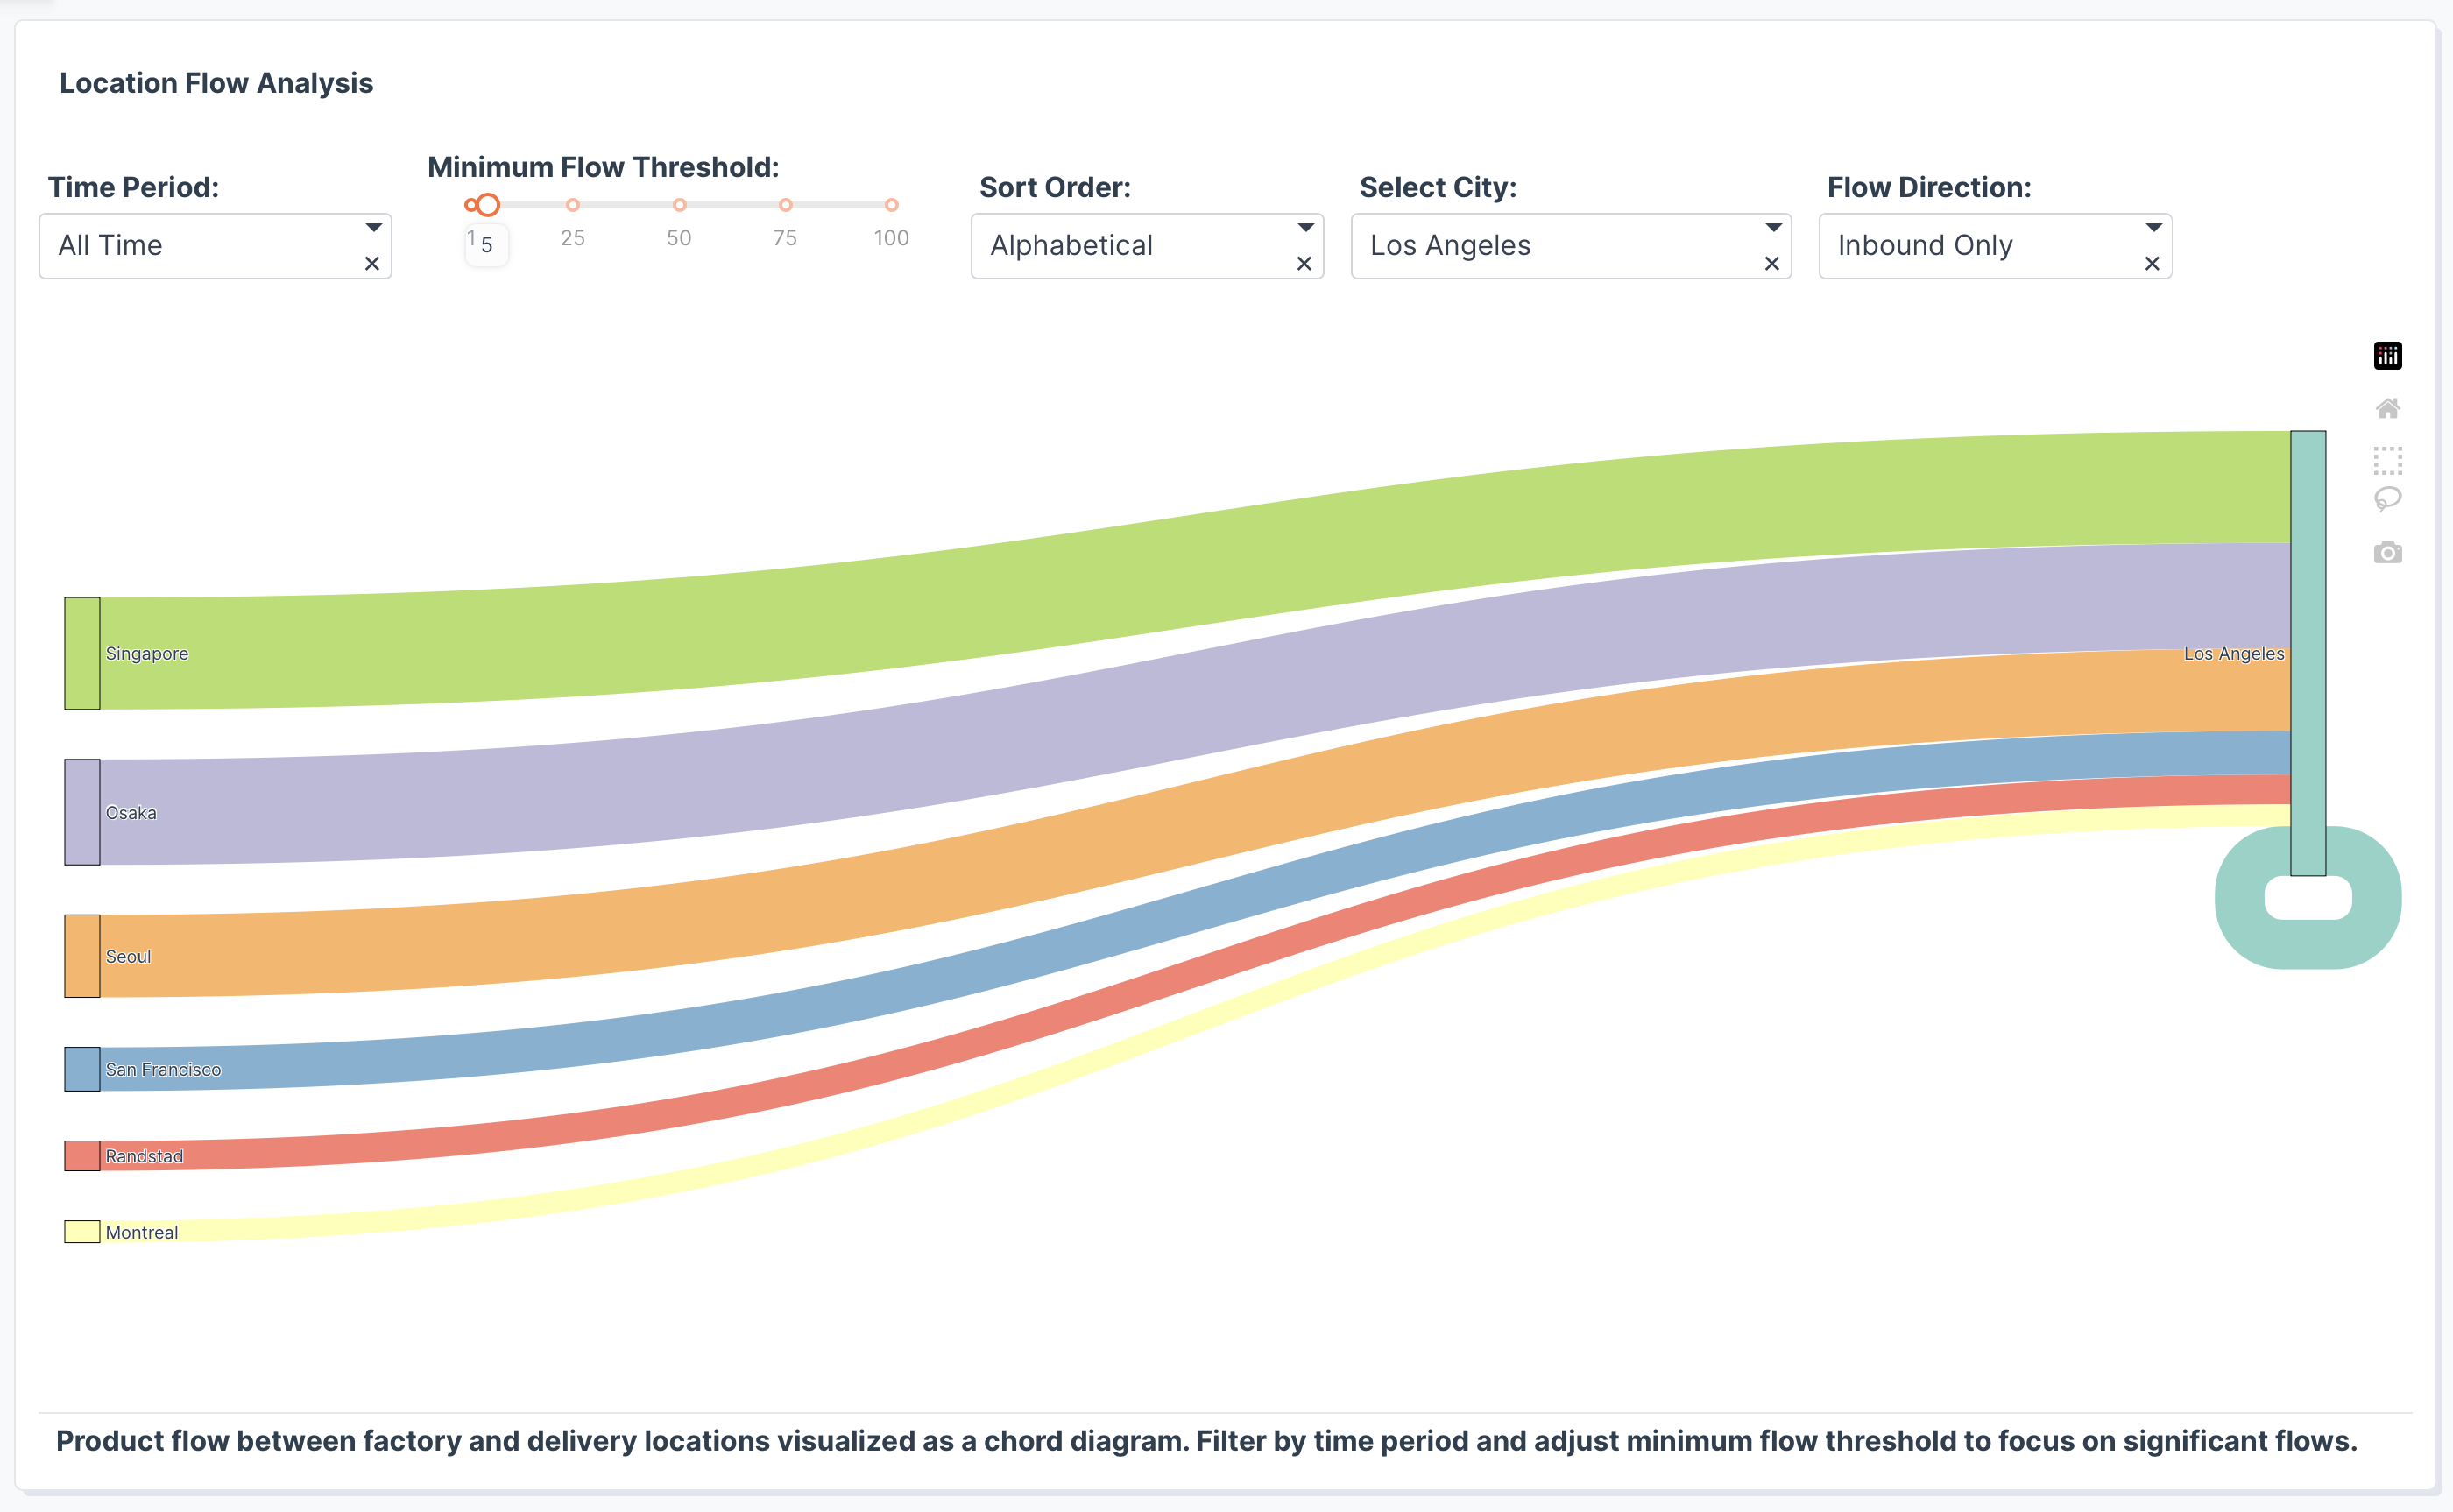
Option to select a single city (vs ALL) and then option to show inbound, outbound, or both for that single city.
- Include options to filter out specific nodes
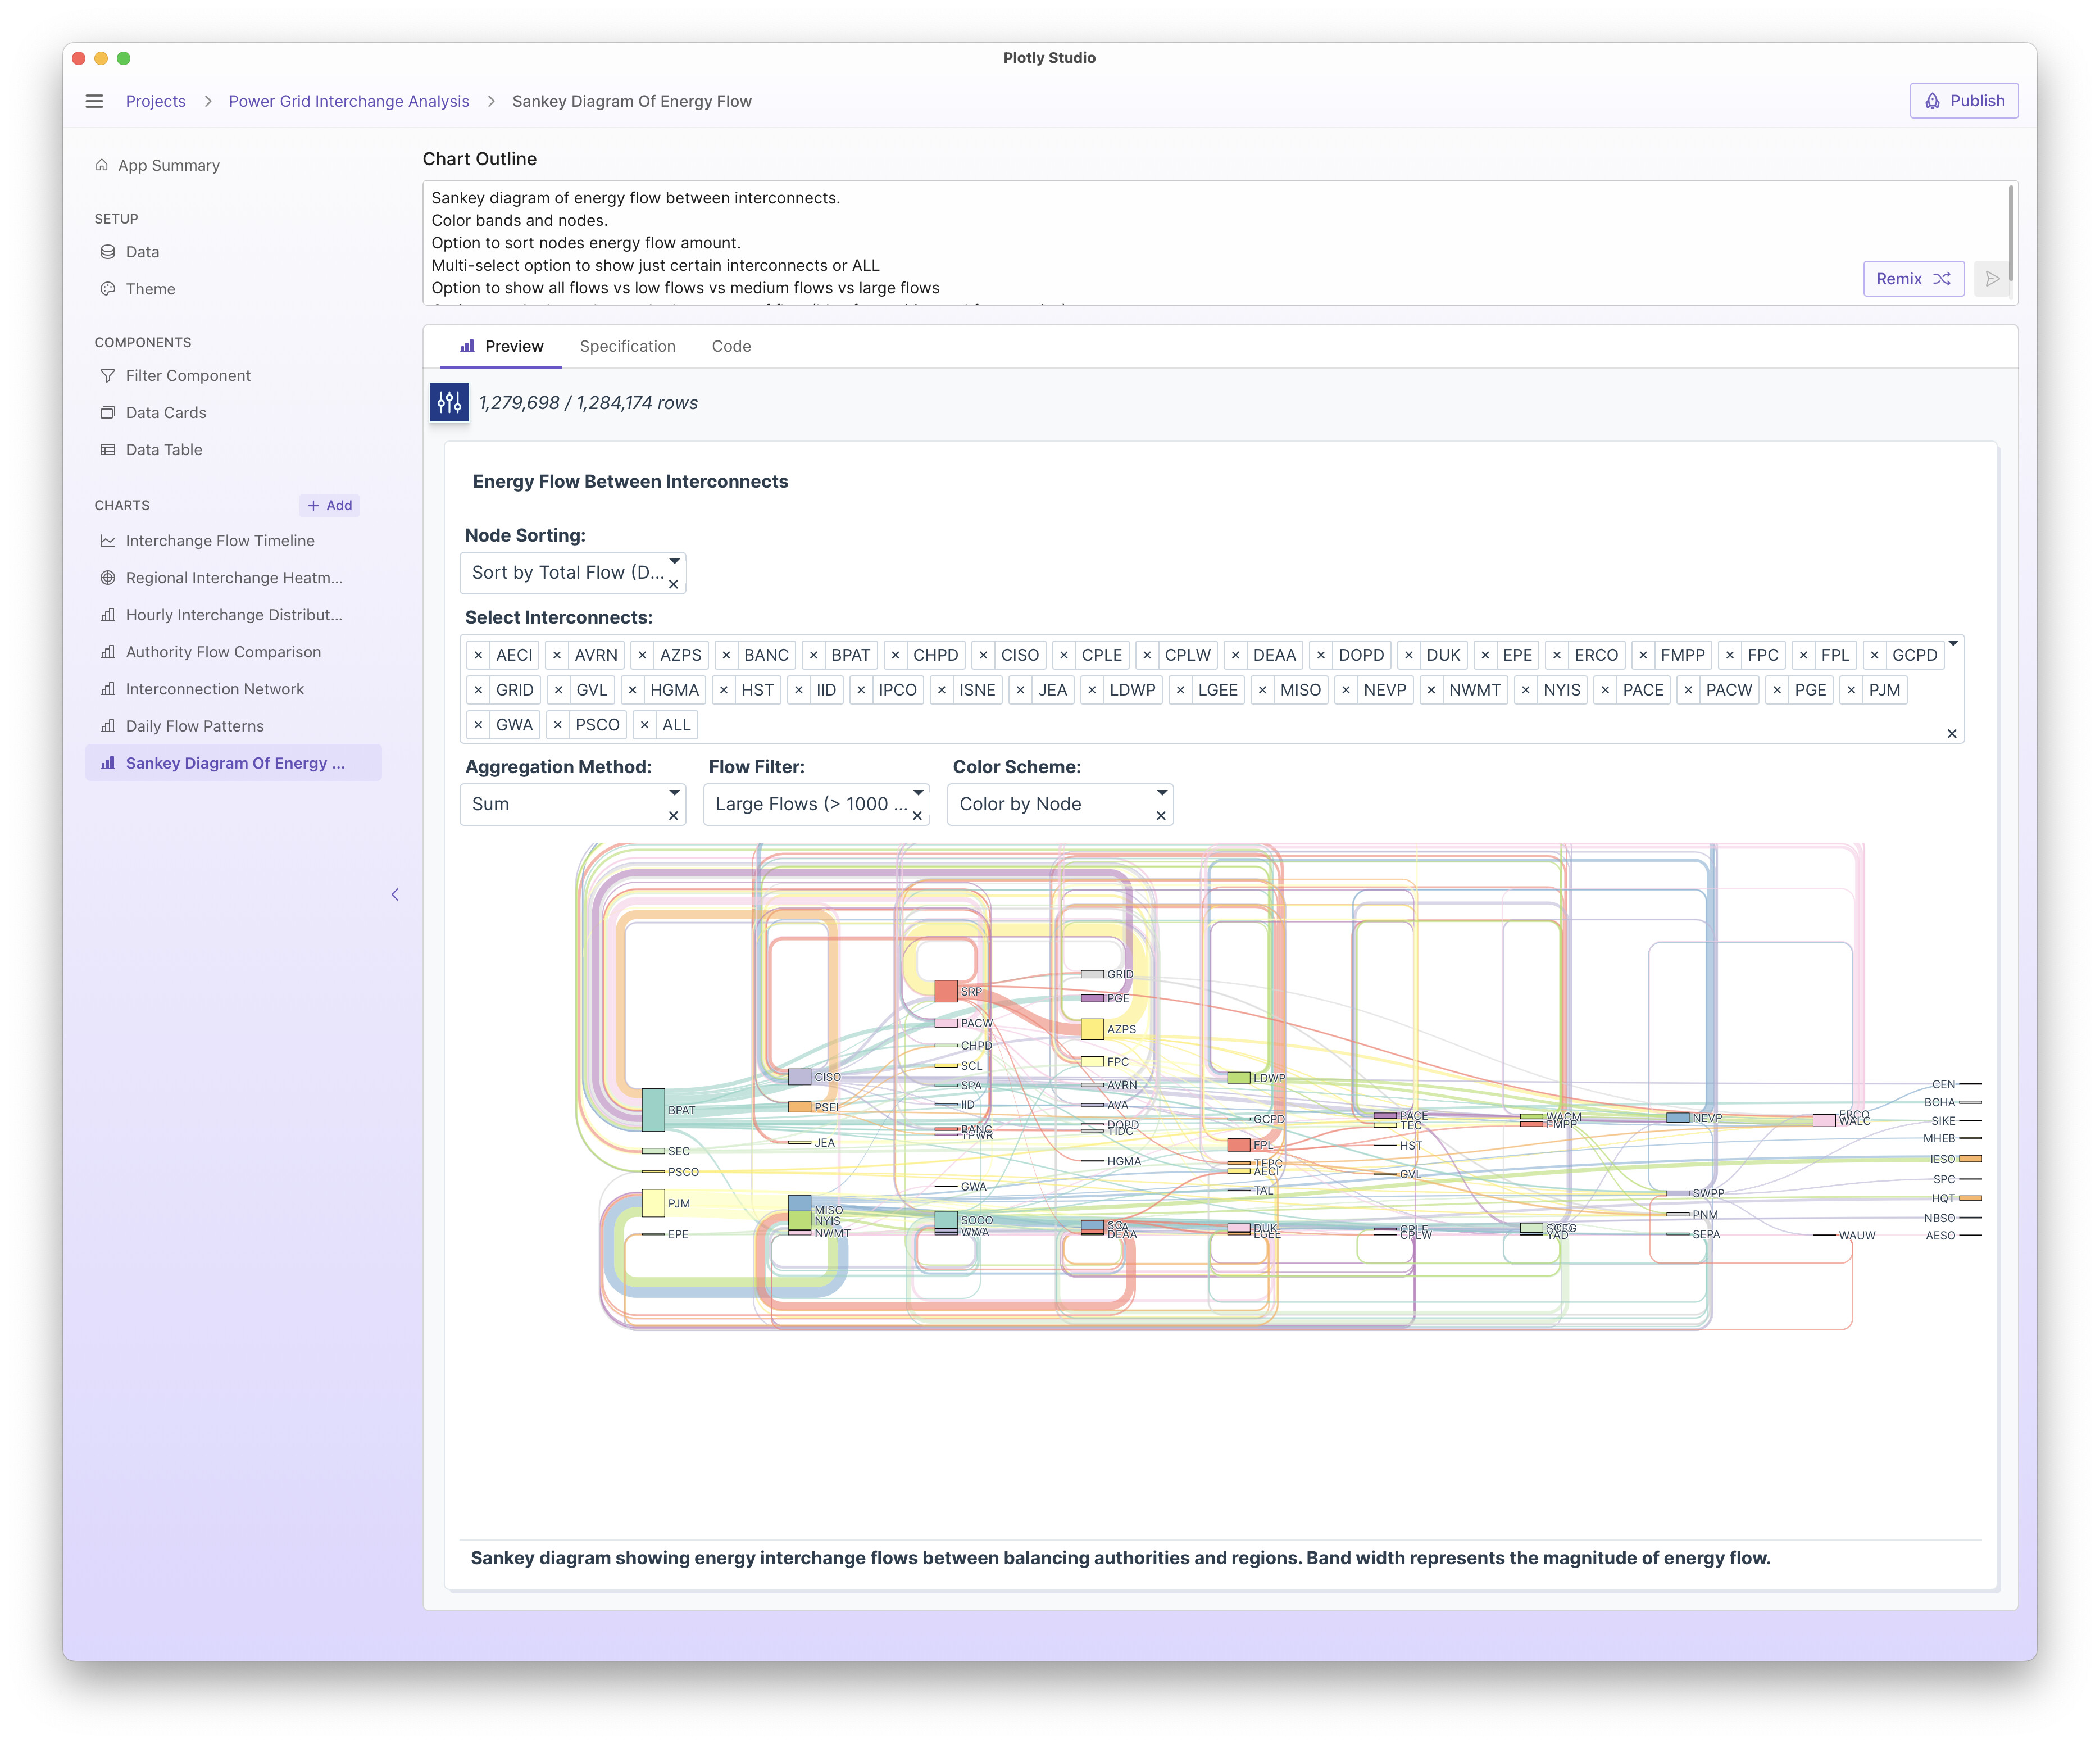
Include a multi-select dropdown to hide/show different nodes with an option for “All”
This can be really helpful if you want to just drill down on certain flows. The diagrams can be pretty overwhelming otherwise without this!
For example, here are all of the nodes:
Vs here is just filtering out to just a few interconnects:
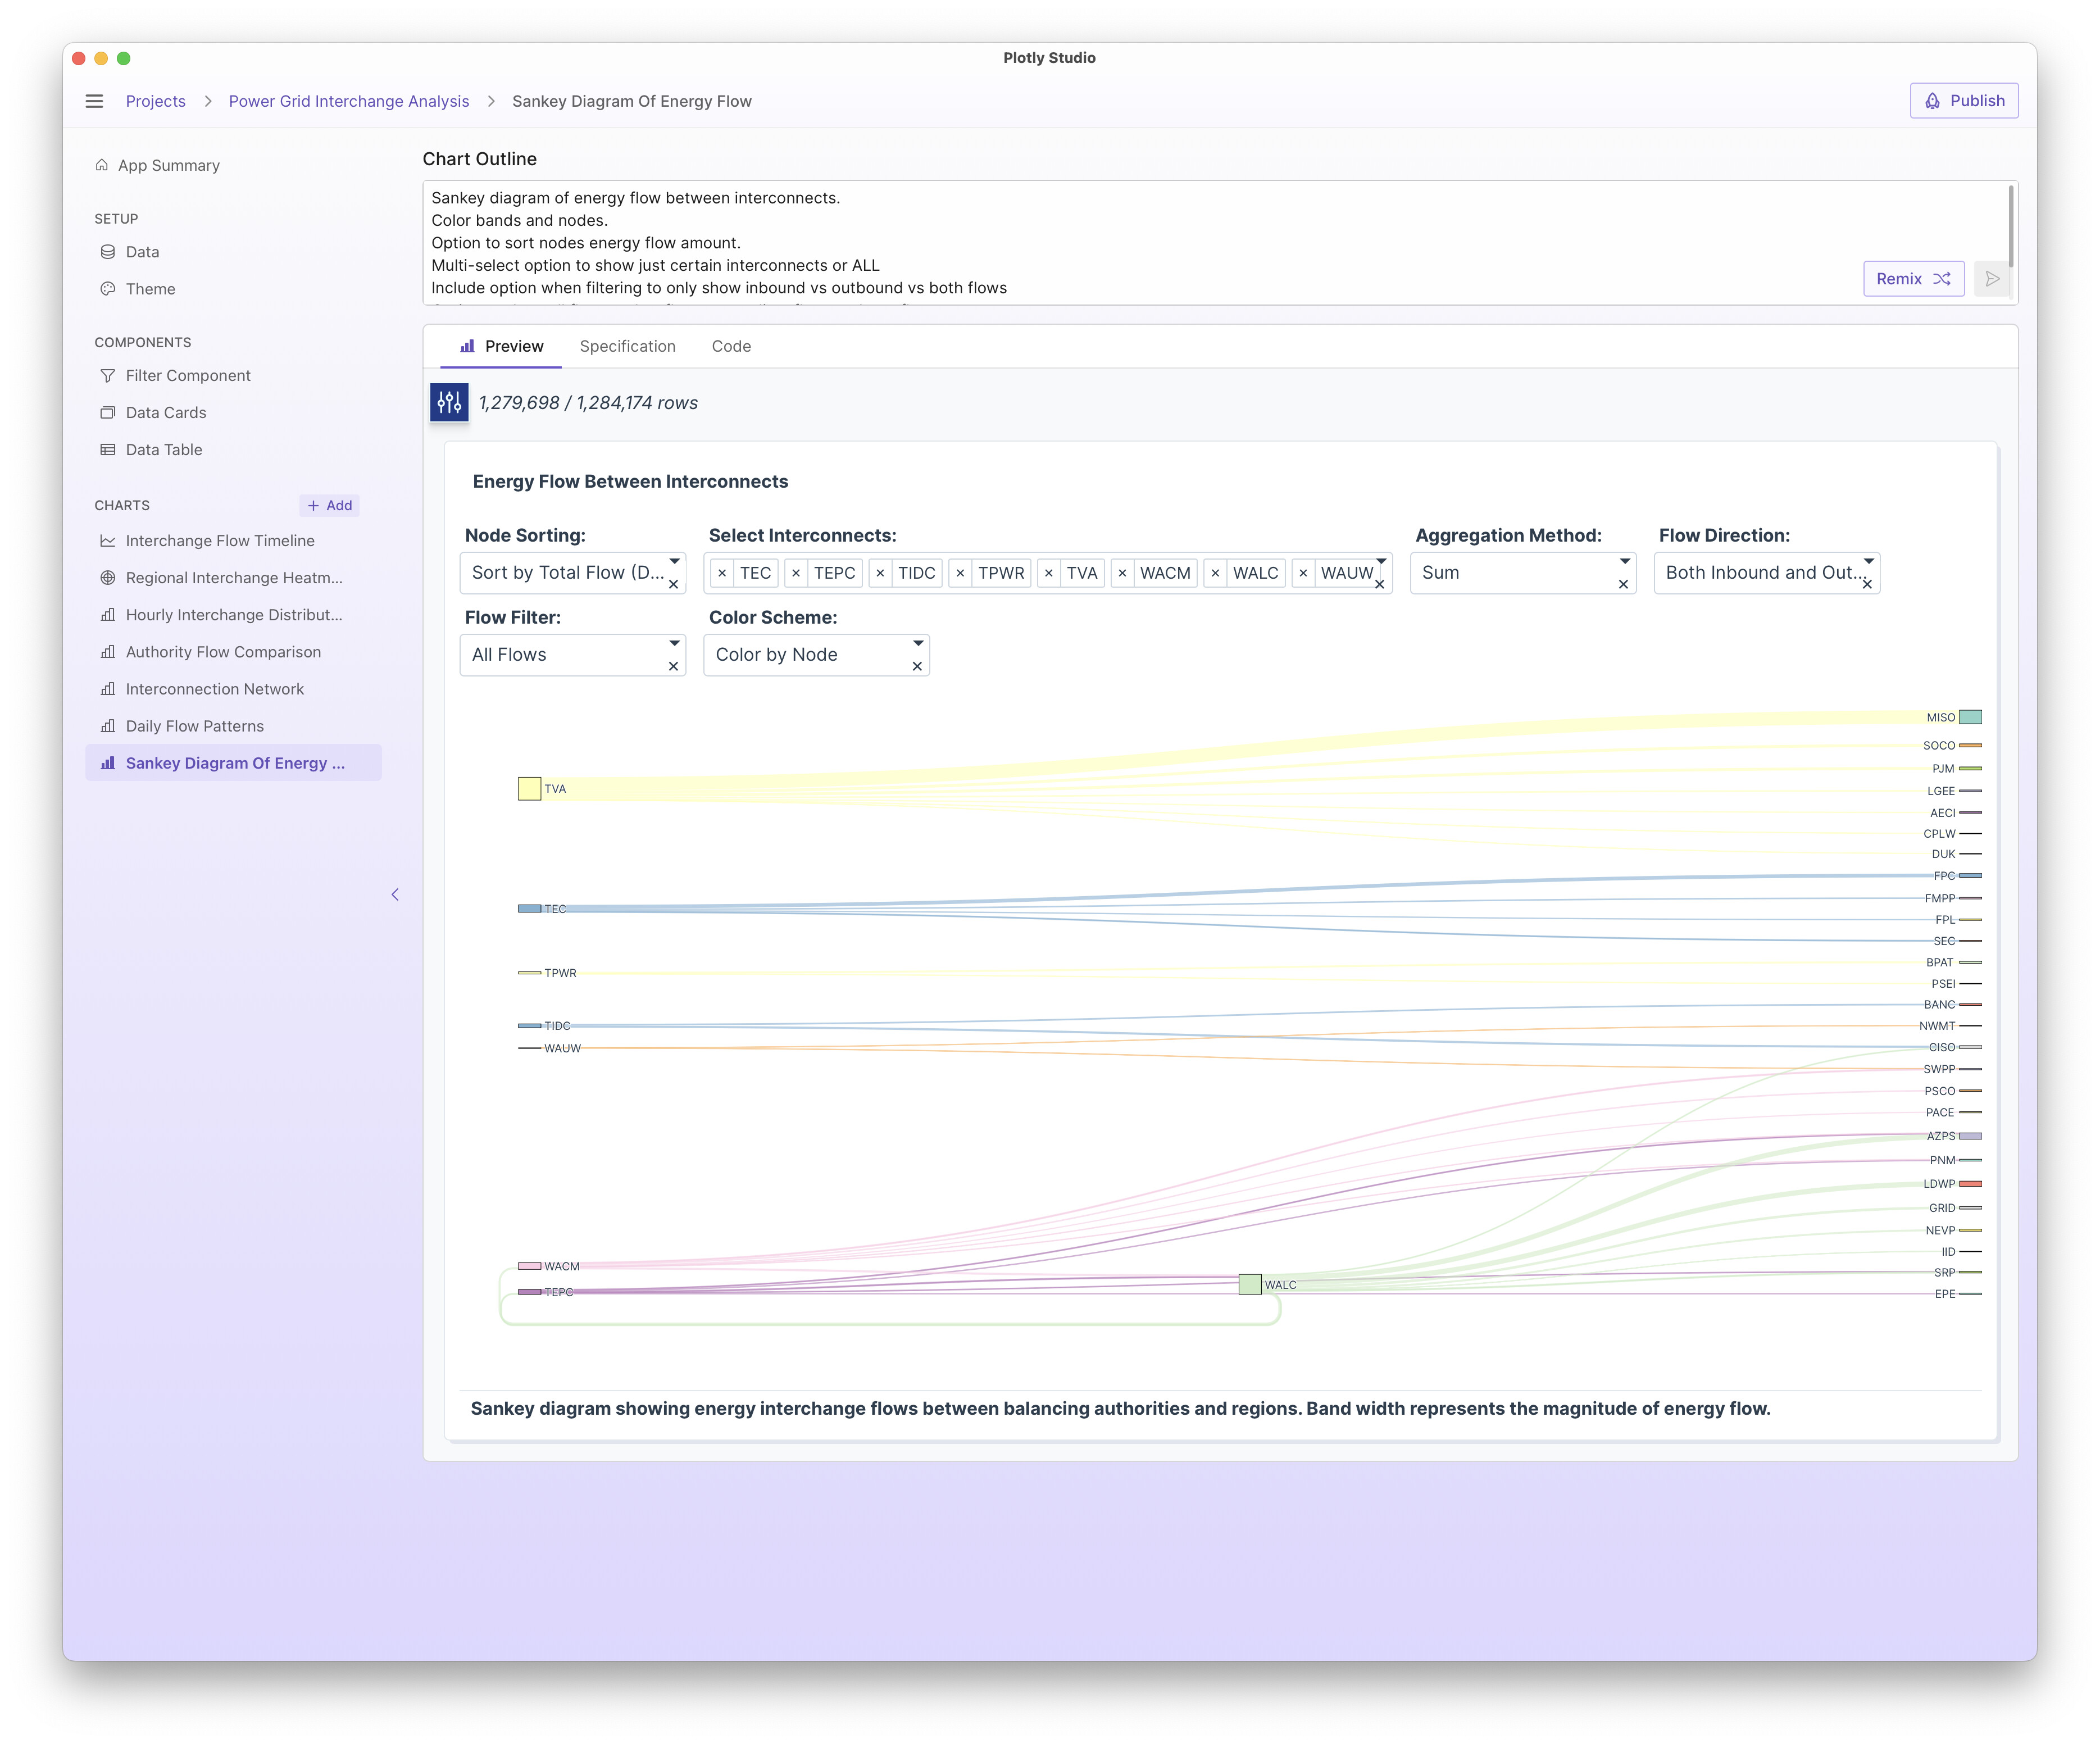
- Filter for inbound vs outbound vs both type of flows
When filtering down to view a specific node, you may want to just view the flows that go in to that node vs flows that go out of it, or both!
Include option when filtering to only show inbound vs outbound vs both flows


- Color by source nodes
Option to color the nodes and the links by factory location OR no color OR color by count (discrete bins)
Color really helps distinguish the various flows. Here’s an example without color:

vs coloring by node

- Filter by flow amount
You can hide a lot of noise by adding a filter to hide certain flows smaller than a certain threshold
- Sort options
You can provide sorting options for the nodes like showing the nodes alphabetically vs showing nodes with the biggest or smallest flows first.
Offer different sorting options to show different cities in different orders.