Hi,
How to resize text automatically to fit the browser window.
For example:
import plotly.graph_objects as go
import dash_bootstrap_components as dbc
import dash
import dash_core_components as dcc
import dash_html_components as html

indicator_style ={"height": 100, 'border-radius': '13px',
                                                       'background': '#FFFFFF 0% 0% no-repeat padding-box',
                                                       'border': '1px solid  #CECECE',
                                                       'box-shadow': '3px 3px 6px #00000029', 'padding': '6px',
                                                       }

fig_1 = go.Figure(go.Indicator(mode="number",
                                         title='<b>'+'Indicator 1'+'<b>',
                                         value=477526,
                                         number={'valueformat': '$,.0f'},
                                         domain={'x': [0, 1], 'y': [0, 1]}))
fig_1.update_traces(number_font_size=33, title_font_size=16, title_font_family='Roboto',
                                          title_font_color="#211C51")

fig_2 = go.Figure(go.Indicator(mode="number",
                                                     title='<b>'+'Indicator 2'+'<b>',
                                                     value=477526,
                                                     number={'valueformat': '$,.0f'},
                                                     domain={'x': [0, 1], 'y': [0, 1]}))
fig_2.update_traces(number_font_size=33, title_font_size=16, title_font_family='Roboto',
                                                title_font_color="#211C51")


fig_3 = go.Figure(go.Indicator(mode="number",
                                                     title='<b>'+'Indicator 3'+'<b>',
                                                     value=477526,
                                                     number={'valueformat': '$,.0f'},
                                                     domain={'x': [0, 1], 'y': [0, 1]}))
fig_3.update_traces(number_font_size=33, title_font_size=16, title_font_family='Roboto',
                                              title_font_color="#211C51")

fig_4 = go.Figure(go.Indicator(mode="number",
                                                     title='<b>'+'Indicator 4'+'<b>',
                                                     value=477526,
                                                     number={'valueformat': '$,.0f'},
                                                     domain={'x': [0, 1], 'y': [0, 1]}))
fig_4.update_traces(number_font_size=33, title_font_size=16, title_font_family='Roboto',
                                          title_font_color="#211C51")

fig_5 = go.Figure(go.Indicator(mode="number",
                                                       title='<b>'+'Indicator 5'+'<b>',
                                                       value=477526,
                                                       number={'valueformat': '$,.0f'},
                                                       domain={'x': [0, 1], 'y': [0, 1]}))
fig_5.update_traces(number_font_size=33, title_font_size=16, title_font_family='Roboto',
                                            title_font_color="#211C51")
fig_6 = go.Figure(go.Indicator(mode="number",
                                                      title='<b>'+'Indicator 6'+'<b>',
                                                      value=0.25,
                                                      number={'valueformat': '.2%'},
                                                      domain={'x': [0, 1], 'y': [0, 1]}))
fig_6.update_traces(number_font_size=33, title_font_size=16, title_font_family='Roboto',
                                           title_font_color="#211C51")

app = dash.Dash(external_stylesheets=[dbc.themes.SANDSTONE])
app.layout = html.Div([
    dbc.Row([
        dbc.Col([dcc.Graph(figure=fig_1, style=indicator_style)],width=2),
        dbc.Col([dcc.Graph(figure=fig_2, style=indicator_style)],width=2),
        dbc.Col([dcc.Graph(figure=fig_3, style=indicator_style)],width=2),
        dbc.Col([dcc.Graph(figure=fig_4, style=indicator_style)],width=2),
        dbc.Col([dcc.Graph(figure=fig_5, style=indicator_style)],width=2),
        dbc.Col([dcc.Graph(figure=fig_6, style=indicator_style)],width=2)
    ])

])

app.run_server(debug=True, use_reloader=False)  # Turn off reloader if inside Jupyter
Normal and Small browser size:
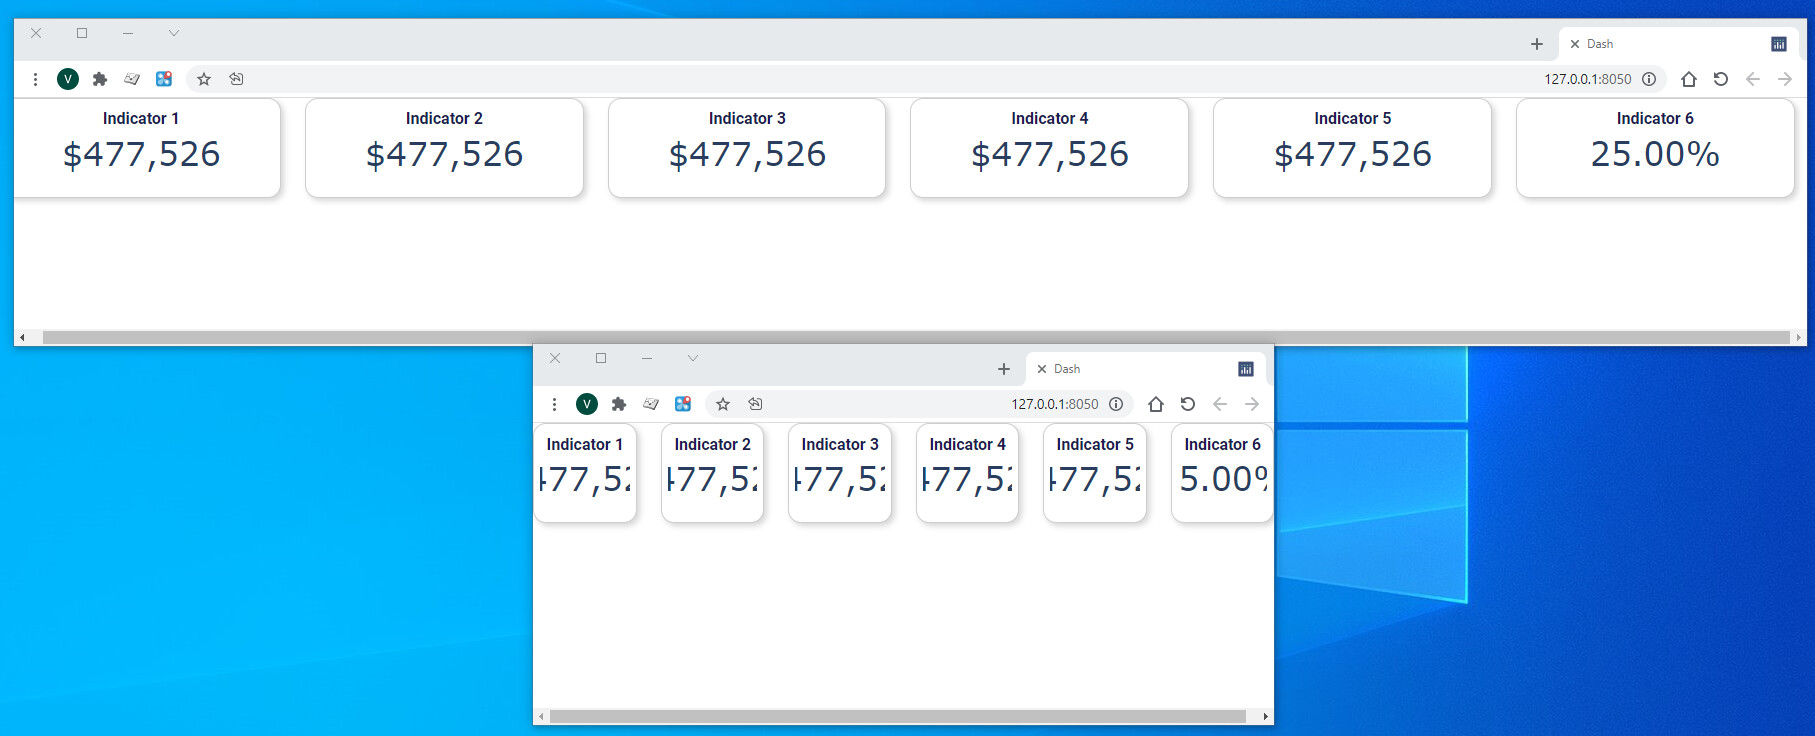
The indicator window decreases, but the text and numbers remain unchanged so nothing can be seen …
How can this be solved?