Django_plotly_dash responsive

Hi,

I’m using django_plotly_dash for a webapp project but the plotly graph isn’t really responsive, so the view on mobile is terrible. I’m wondering is it possible to make it more responsive?

Below is my code.
test_plotly.py

import dash_core_components as dcc
import dash_html_components as html
from django_plotly_dash import DjangoDash
import plotly.graph_objects as go

app = DjangoDash('test_plotly',
    meta_tags=[
        {"name": "viewport", "content": "width=device-width, initial-scale=1"}
    ]
)

xaxis = [50000,60000,70000,80000,90000,100000,120000,
                140000,160000,180000,200000,220000,240000,260000,280000, 300000]

yaxis = ['L1', 'L2','L3','L4','L5','L6','L7','L8','L9','L10','L11','L12','L13','L14','L15','L16']

fig2 = go.Figure(data = [go.Bar(name = 'Total', y = yaxis, x = xaxis, orientation='h')])

app.layout = html.Div(
    style={'backgroundColor':'white', 'fontFamily': ["Segoe UI",]}, 
    children=[
        html.Div([
            dcc.Graph(
                id = 'test',
                figure = fig2
            )
        ])
    ])

test-plotly.html

{% extends 'survey/base.html' %}
{% load plotly_dash %}

{% block content %}
    <H1 style ="text-align: center">Test</H1>
    <hr>
    <h2 style ="text-align: center">Plotly</h2>
    {% plotly_app name="test_plotly" ratio=1 %}


{% endblock content %}

base.html is using basic bootstrap

<body style ='background-color:white'> 
    <main role="main" class="container">
      <div class="cover-container d-flex w-100 h-100 p-3 mx-auto flex-column">  
      
        <div class = 'container' style = 'background-color:#ffffff'>
          <div class="row justify-content-center">   
            <div class="col-12">     
                {% block content %}
                {% endblock %}
            </div>
          </div>
        </div>
      </div>
    </main>
</body>

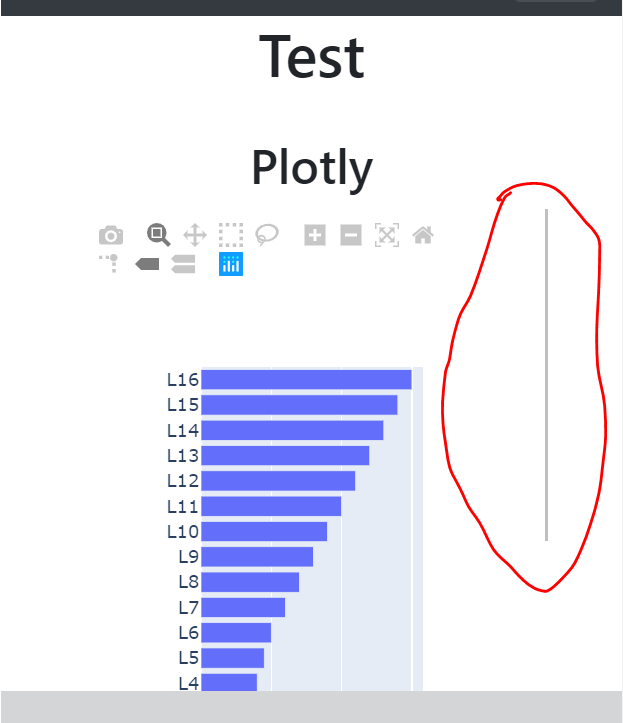
The above looks great on a computer screen but when viewing on mobile, a scroll bar shows up on the plotly chart, see below. AND the graph doesn’t shrink proportionally. In this example, it seems like the graph is being squeezed horizontally.

If I change test-plotly.html to have a larger ratio, e.g.
{% plotly_app name="test_plotly" ratio=3 %}
that scroll bar will go away but it will also leave a very large white space below the chart, especially when viewing on a computer screen.

Is there anyway to make the graph more responsive (i.e. no scrolling bar and shrink proportionally, etc.) while not leaving a big white space?

Thanks!

There is a plotly_app_bootstrap template tag that inserts a responsive component. See this demo showing it in use.

Documentation can be found here.

Thank you @delsim. You were always quick to provide an answer!
Using the plotly_app_bootstrap template tag did get rid of the white space view on a computer screen. However the scrollbar still shows up when viewing on a mobile device even with aspect =1by1…
My code:

test-plotly.html

{% extends 'survey/base.html' %}
{% load plotly_dash %}

{% block content %}
    <div class="container">
            <div class="row"> 
                <div class="col-sm-12">
                    <H1 style ="text-align: center">Test</H1>
                    <br>
                    <h2 style ="text-align: center">Plotly</h2>
                    <div class="{% plotly_class name='test_plotly' %}">
                        {% plotly_app_bootstrap name="test_plotly" aspect="1by1" %}
                    </div>
                </div>
            </div>
        </div>
{% endblock content %}

Any alternative solution to this? Much appreciated!

It will depend to some extent on why the scrollbar is there as to what the best solution is - it seems in your example that there is content out of sight off the bottom of the screen, for example - but you can control it with css. Something along the lines of

.some-class-name {
    overflow: hidden; /* rather than scroll or inherit */
}

should do the trick; this is a not uncommon problem so you should be able to search out solutions that are more relevant if needed.

Thank you @delsim for the pointer! I’m really a newbie at css & js, but will do some research on that front!

Hello @iwannasee

I have the same problem, could you solve it?

Another thing, I see that you have been able to use a Dash application with the name test_plotly, I have not been able to use a name other than SimpleExample, could you help me or share a little about how you did it? I have asked the question here.

Thanks!