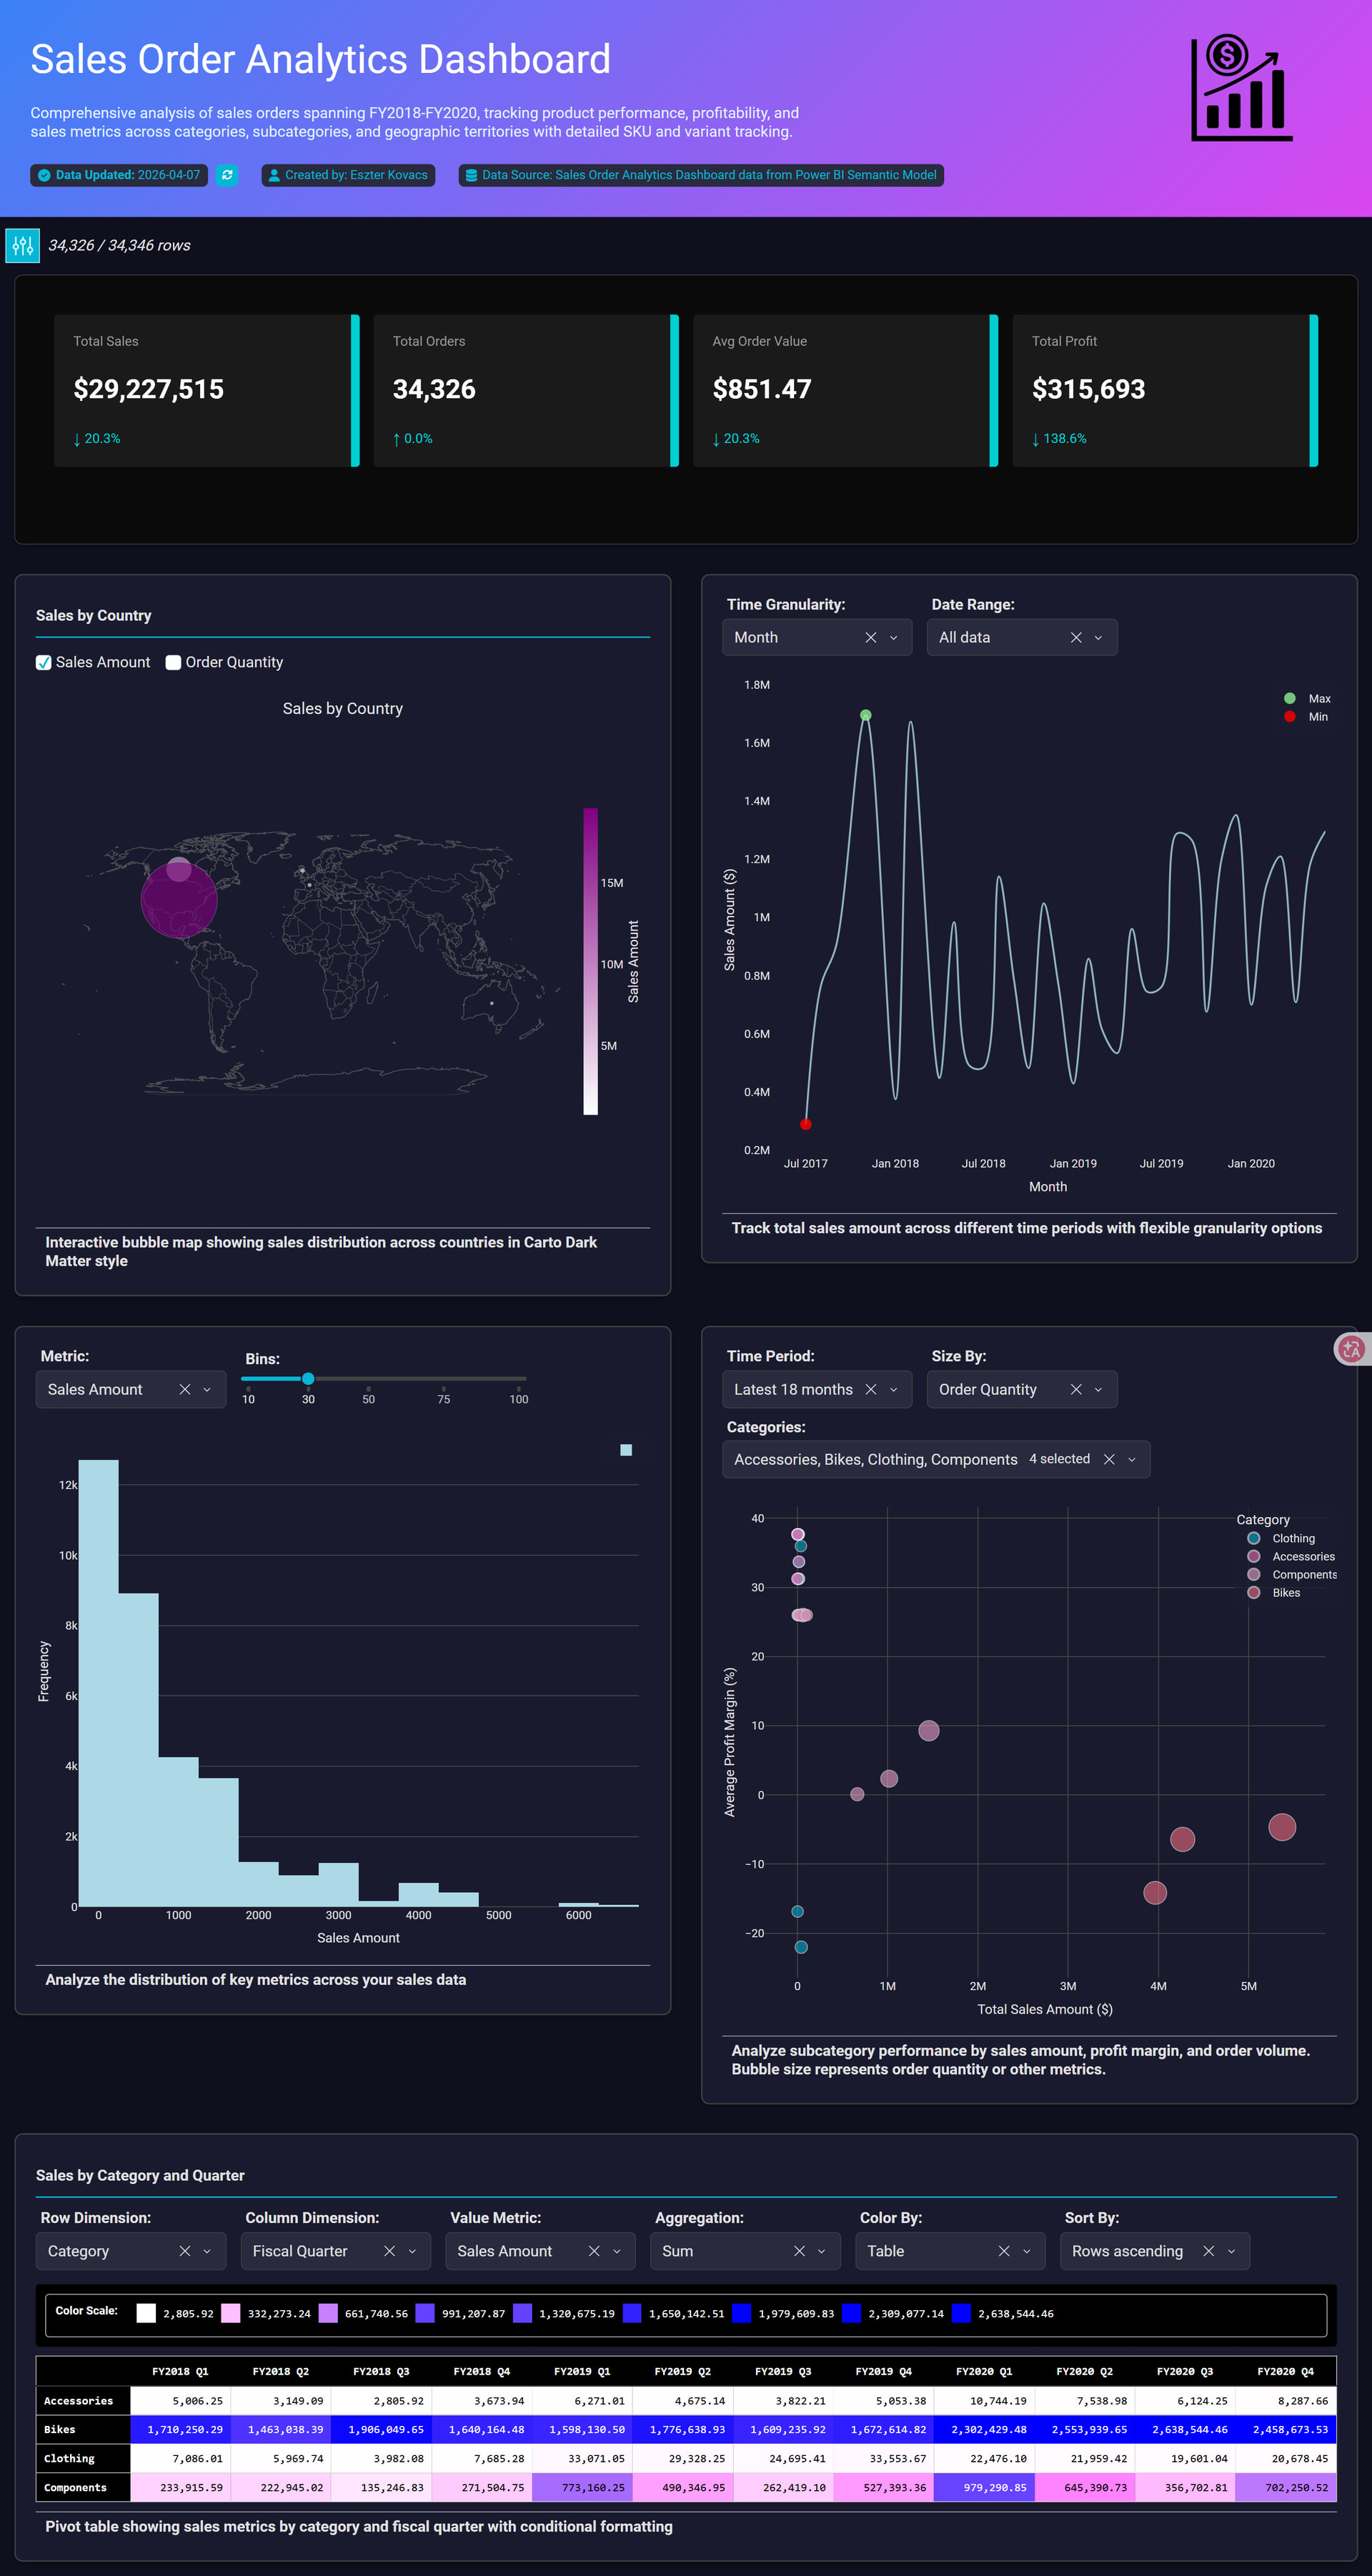
This Sales Order Analytics Dashboard was developed from Power BI using the AdventureWorks Sales semantic model. After providing the required credentials and establishing the connection, the dataset was loaded into Plotly Studio, where AI-assisted analysis was used to identify and select four core tables from the semantic model to create a streamlined but analytically rich reporting solution.
The dashboard combines multiple visualization techniques to analyze sales performance across FY2018–FY2020 and deliver both executive-level insights and operational analysis. The report includes:
-
KPI cards displaying Total Sales, Profit, Orders, and Average Order Value
-
A time-series line chart for monthly sales trend analysis
-
A bubble/scatter chart comparing Sales vs Profit Margin across product categories
-
A geographic map visualization showing regional sales distribution
-
A histogram illustrating transaction value distribution
-
A pivot table with conditional formatting for category-level performance comparison
-
Interactive slicers for dynamic filtering by category and date
Key business insights:
-
Total sales exceeded $29.2M with more than 34K completed orders.
-
Sales trends show recurring seasonal peaks and consistent year-over-year growth patterns.
-
Bikes generated the highest revenue contribution among product categories.
-
Several high-sales segments operate with lower profit margins, highlighting potential pricing and cost optimization opportunities.
-
Most transactions fall within lower sales ranges, while a smaller number of high-value orders contribute significantly to total revenue.
-
Geographic analysis reveals concentrated sales activity across selected regions.
The dashboard was designed with a modern dark-theme UI and neon-accent styling to enhance visual hierarchy, readability, and professional presentation quality while maintaining analytical depth.
Plotly Cloud link: https://9448cbcf-87c3-4804-a07a-67a0e3989289.plotly.app/