Hello Community,
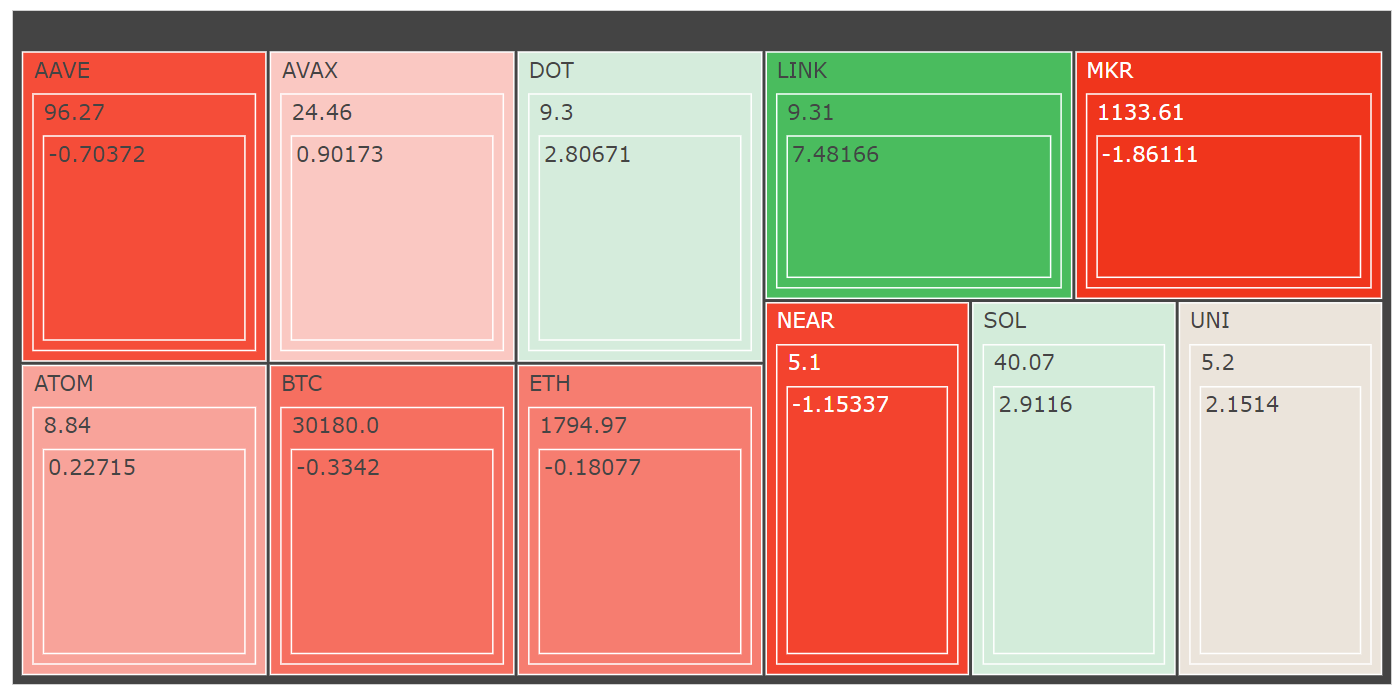
I am having some issues formatting a plotly express treemap. Basically I just want to remove dark grey space and format the decimals as a percent.
See code:
fig = px.treemap(df, path=[df['Asset'],df['Price'], df['Change']],
                 color=df['Change'],
                 color_continuous_scale=colors
                 )
fig.update_layout(
    title=format_title("<b>Top Large-Cap Movers<b>", "Past 24 Hours"),
    #treemapcolorway = colors,
    margin=dict(l=40, r=40, t=90, b=60),
    autosize=False,
    hovermode = False,
    width=1000,
    height=600,
    font=dict(
    size=14,
    color="#120B2C", # Blockworks Darker Blue
    )
)
fig.show()
See image:
Thanks,