How can I display percentage subtotals at each category level in treemap chart?

I am looking to display % of total upper category values at each category and sub-category level in a treemap chart. Is there a way to do this ?

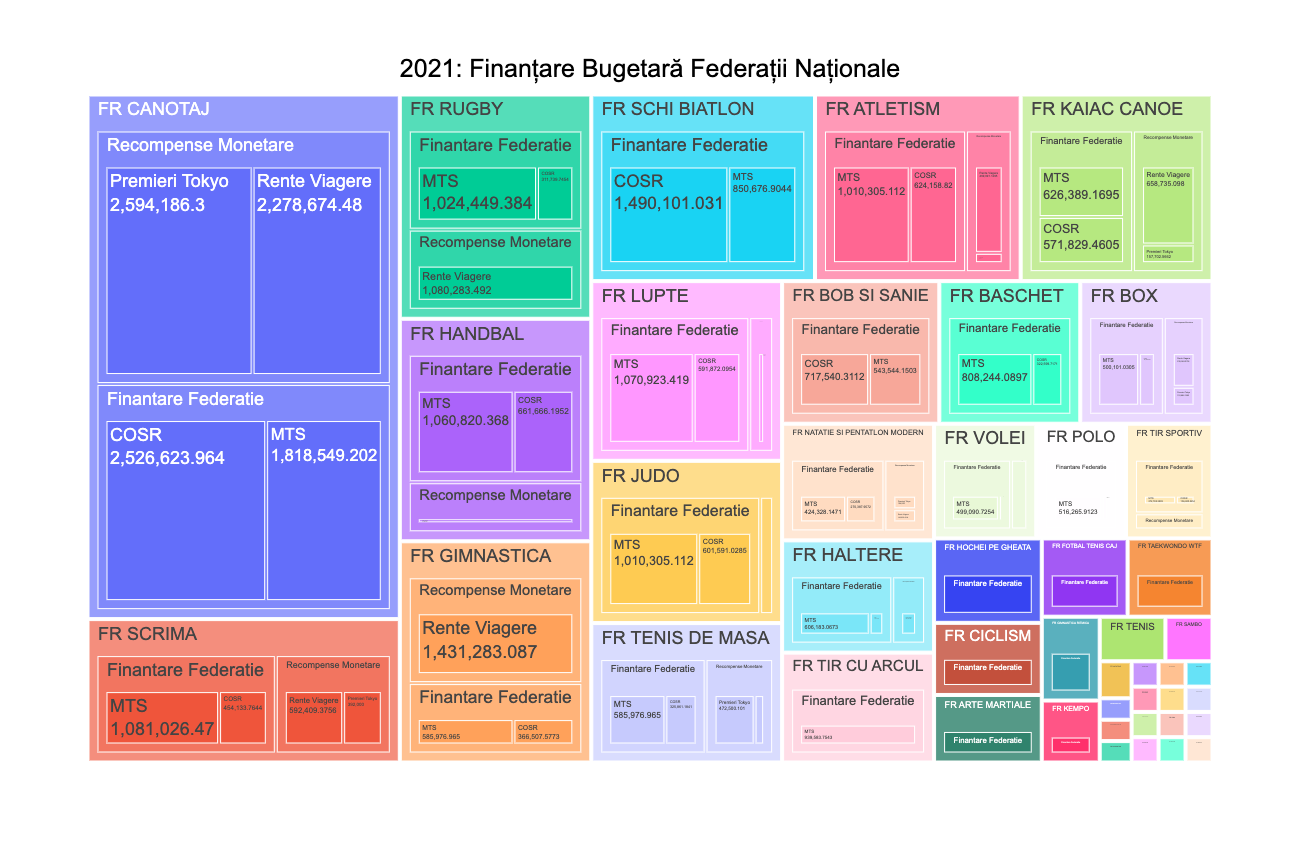
For example, I would want to display % of total for FR CANOTAJ , then % of FR CANOTAJ for ā€œRecompense Monetareā€ and ā€œFinantare Federatieā€, and so onā€¦ Do I need that data calculated in the original df, or is plotly able to do this by itself ?

fig = px.treemap(df,
                 path=['Federatia',"Functional Category","Sursa"],
                 values='Suma EUR')

fig.update_layout(title={'text': "2021: Finanțare Bugetară Federații Naționale",
                         'y':0.93,
                         'x':0.5,
                         'xanchor': 'center',
                         'yanchor': 'top'},
                  font=dict(family="Arial",
                            size=18,
                            color='#000000'),
                  width=1300, height=850)
fig.data[0].textinfo = 'label+text+value'

fig.update_layout(annotations=[
       go.layout.Annotation(
            showarrow=True,
            text='Subtitle',
            xanchor='left',
            x=20,
            xshift=275,
            yanchor='top',
            y=0.5,
            font=dict(
                family="Courier New, monospace",
                size=20,
                color="#0000FF"
            )
        )])


fig.show()

1 Like

Try ā€œpercent {parent|root|entry}ā€, details below:

textinfo: determines which trace information appear on the graph that can be ā€˜textā€™, ā€˜valueā€™, ā€˜current pathā€™, ā€˜percent rootā€™, ā€˜percent entryā€™, and ā€˜percent parentā€™, or any combination of them.

Thank you @PlotThis .

Just to clarify, whatā€™s the exact syntax of that ?

fig.data[0].textinfo = 'percent {parent|root|entry}'

?

Doesnt seem to work

Blockquote
ValueError:
Invalid value of type ā€˜builtins.strā€™ received for the ā€˜textinfoā€™ property of treemap
Received value: ā€˜percent {parent|root|entry}ā€™

The 'textinfo' property is a flaglist and may be specified
as a string containing:
  - Any combination of ['label', 'text', 'value', 'current path', 'percent root', 'percent entry', 'percent parent'] joined with '+' characters
    (e.g. 'label+text')
    OR exactly one of ['none'] (e.g. 'none')

lacking parity with px.pie

Many upvotes on SO:

This is pretty old already, but in case somebody stumbles upon it: I think using textinfo only defines which values are displayed at the lowest level, so it doesnā€™t really answer the original question. Correct me if Iā€™m wrong.

But regarding the syntax question, you can set it using any combination of these values separated by a plus sign (+): 'label', 'text', 'value', 'current path', 'percent root', 'percent entry', 'percent parent'. For example:

fig.data[0].textinfo = 'percent parent+percent root+parent entry}'

This will show something like this:

55% of parent
34% of entry
34% of root

1 Like