Creating percentage bar chart

I am attempting to create a bar chart with x as a category, and y as another category shown by % of total. I have done this with timeseries data but am having trouble creating it for your standard categorical columns.

Here is what I am looking to achieve:

Here is the format I have my data in so far:

{'at_home': array([8, 1, 7, 4]),
 'health': array([3, 3, 3, 9]),
 'other': array([82, 13, 62, 60]),
 'services': array([41, 14, 30, 26]),
 'teacher': array([11,  5,  7,  6])}

with each col slice of the array mapping to a specific y value.

Are there any ideas? The data can also be seen in a groupby or a pivot.

TIA!

Hi @plotmaster422 ,

I think the idea is making the columns as yaxis label by using transpose method, so the categories will be set as the index of dataframe.

The number of columns is the number of traces, and every trace can be named as rate (“Bad”,“Good”,…).

import numpy as np
import pandas as pd

import plotly.express as px

colors = ['rgba(38, 24, 74, 0.8)', 'rgba(71, 58, 131, 0.8)',
          'rgba(122, 120, 168, 0.8)', 'rgba(164, 163, 204, 0.85)',
          'rgba(190, 192, 213, 1)']

data = {'at_home': np.array([8, 1, 7, 4]),
        'health': np.array([3, 3, 3, 9]),
        'other': np.array([82, 13, 62, 60]),
        'services': np.array([41, 14, 30, 26]),
        'teacher': np.array([11,  5,  7,  6])}

rates = ["Bad","Neutral","Good","Execllent"]

# create dataframe
df_ori = pd.DataFrame(data)

# get sum over rows 
n_samples = df_ori.sum(axis=0)

# calculate the percentage values over rows 
df_data = df_ori/n_samples

# transpose data
# so the category will set as y axis labels
# because we will create every trace is by rate
df_data = df_data.T

# adding new columns rates
df_data.columns = rates

# create new column to customize y label
# set y label column as index
df_data['y label'] =  ["{} (n={})".format(y.replace("_"," ").title(), val) for y, val in n_samples.to_dict().items()]
df_data = df_data.set_index(['y label'])

# print cleaned data
print(df_data)

# using plotly express make horizontal bar chart
fig = px.bar(df_data,x=df_data.columns, y=df_data.index, color="variable", color_discrete_sequence=colors)


# set barmode to "stack" and 
# xaxis format as percent
fig.update_layout(
    barmode="stack",
    xaxis= dict(
        tickformat= '.0%',
        title='Percent'
        ),
    yaxis= dict(
        title='Category'
        ),
    legend=dict(
        title=''
    )
)

fig.show()

3 Likes

Beauty~

So it was trickier than I thought, then. I would not have known to access the color attribute with the keyword “variable” without defining it elsewhere in the code; so interesting.

Thanks!

1 Like

Hi @farispriadi at the risk of sounding dumb how did you assign that value of “variable” inside of the dataframe? Your example works but when I use a same type dataframe it throws an error. Am I right to say the var name “variable” appears nowhere else in your code?

I was able to successfully plot the chart with the tricky df.columns and df.index calls, without calling any color variable and just setting color_discrete_sequence. But would be curious as to how you assigned color to the chart.

Hi @plotmaster422 ,

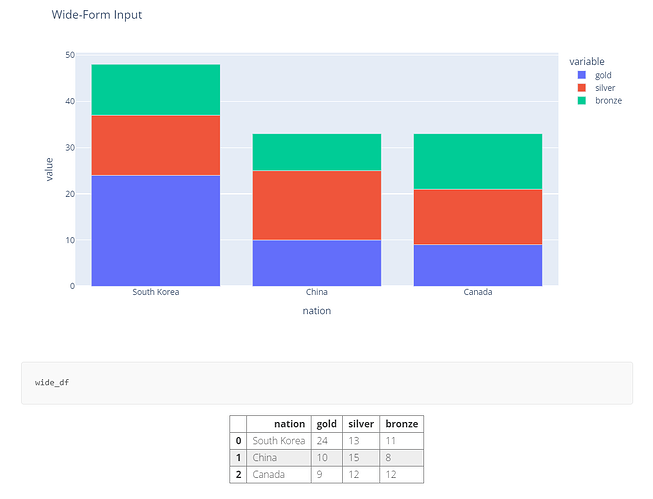
Actually the keyword “variable” appeared because the attribute “x” is set by list of column names.
As I understand it will generate the name of the legend as “variable”, which is the name of all columns.

Here is the data frame before generated into plot :

                       Bad   Neutral      Good  Execllent
y label
At Home (n=20)    0.400000  0.050000  0.350000   0.200000
Health (n=18)     0.166667  0.166667  0.166667   0.500000
Other (n=217)     0.377880  0.059908  0.285714   0.276498
Services (n=111)  0.369369  0.126126  0.270270   0.234234
Teacher (n=29)    0.379310  0.172414  0.241379   0.206897

in my latest code , you can comment legend title in update_layout, so the “variable” will be appeared as lagend title.

You can also check examples from link below about same topics.
The difference is the example below has vertical orientation, so the y attribute that sets in multiple columns.

Hope this is answering your question.

If your code still produce an error, please let me know.
You can share here or you can drop in private message.

Regards.

Thanks for the detailed response!

No, code is good, just wanted to confirm that “variable” is indeed the keyword to use.

1 Like