Dear,
I am running a Dash App on 2 different PC’s. For one PC, I get correct results when creating a px.timeline figure (see below)

For the other PC, with the same code, both running Python 3.7, I get the following image:

Now I have read that the latter results gets created when the differences (time between start and finish) is less than 10 seconds. However, this issue was resolved in plotly release 4.11 (px.timeline chart incorrectly displays timeframes of 10 seconds and smaller. · Issue #2658 · plotly/plotly.py · GitHub).
Regarding the packages, I have for both PC’s the similar version of Dash and Plotly (see images below)
PC 1:


PC 2:
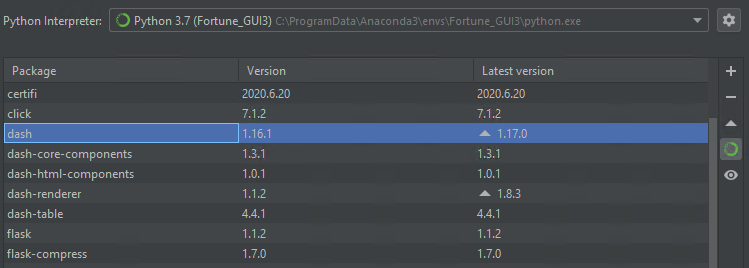

Only differences are in the releases of dash-core-componentns, dash-html-components and dash-bootstrap-components. Unfortunately I cannot install the versions running on the good PC, on the bad PC, as they don’t seem to be available according to PyCharm. Also, I don’t think this should have anything to do with the issue, since when creating the same figure in a notebook, on the correct PC, I also get a correct result.
Also, when I discard all rows that have a delta lower than 10, I get a better result, not showing these large blocks anymore. However, some strange behavior occurs, as can be seen below: setup has small delta, but is plotted as large delta, which shouldn’t be possible.

How could it be possible that at one PC, I get correct results, whether the other shows a bug that should have been fixed. Hope anyone can shed some light on this. Thanks!