Hi,
I already posted a reply to this thread in plotly.js (Px.timeline: short events in large scale timeline), but since I’m working with python I thought I’d post here as well.
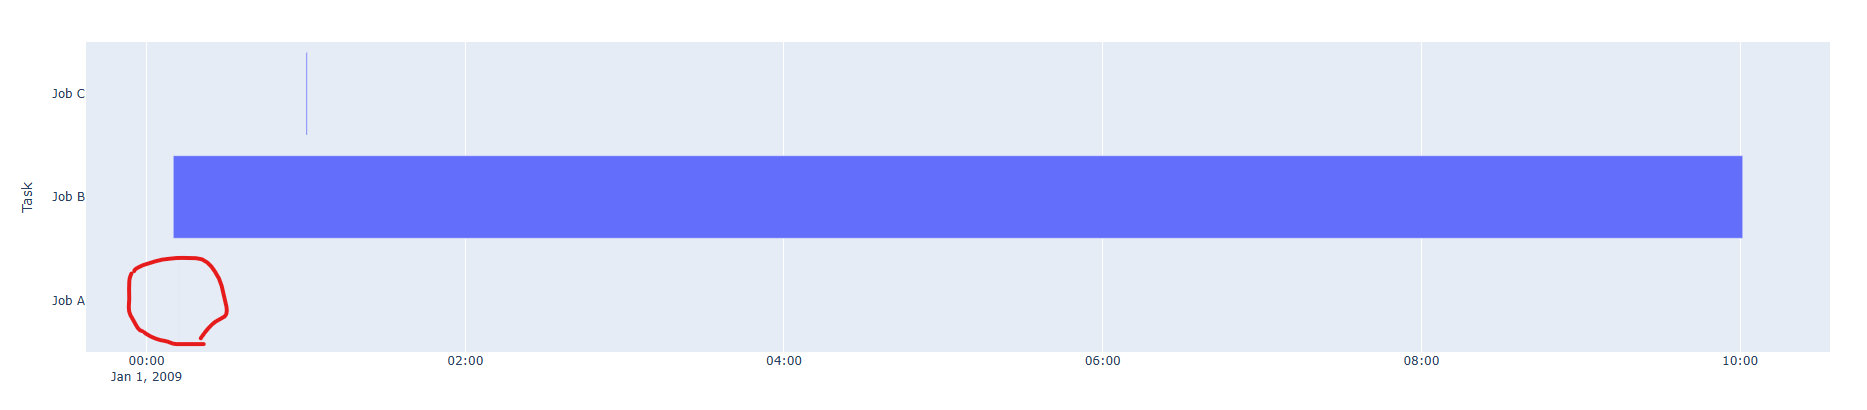
I have timeline events that don’t show up because there time span is << the time span of other events. Here’s the code in question:
import pandas as pd
import plotly.express as px

df = pd.DataFrame([
    dict(Task="Job A", Start='2009-01-01T00:12:01Z', Finish='2009-01-01T00:12:03Z'),
    dict(Task="Job B", Start='2009-01-01T00:10:01Z', Finish='2009-01-01T10:01:01Z'),
    dict(Task="Job C", Start='2009-01-01T01:00:01Z', Finish='2009-01-01T01:00:31Z')
])

fig = px.timeline(df, x_start="Start", x_end="Finish", y="Task")
fig.show()
Notice how job a is basically invisible. Is there a way to set a minimum display width for near instantaneous events?