Plotly graph object : add area chart to scatter plot

i want to add area chart to every scatter chart in my dash app. some conexte about dash app: it has 2 section: first section for data input from different users . Second part is to plot previously paramaters typed by users in scatter plots. So user select partamters to visualize and then for every paramter a scttaer plot is displayed. I have a fixed paramter that i want to always display on every scatter plot as an area chart.

I’m using this function :

def update_visualization(selected_product, selected_params):
    if selected_product and selected_params:
        filename = f"{selected_product}_data.csv"
        if os.path.exists(filename):
            df = pd.read_csv(filename)
            df['timestamp'] = pd.to_datetime(df['timestamp'])

            # Filter the data based on selected parameters
            filtered_df = df[df['parameter'].isin(selected_params)]
            fig=make_subplots(rows=len(selected_params), cols=1, subplot_titles=[f"Evolution of {param}" for param in selected_params])
            color_dict={"User1":"red","User2":"blue","User3":"green"}
                #for user, color in color_dict.items():
            # Create a figure with subplots for each parameter selected
            #fig = go.Figure()
            
            h_data=df[df['parameter'] == 'H'] # filter H data 
            print("h DATA HERE", h_data)
            for i, param in enumerate(selected_params, start=1):
                param_data = filtered_df[filtered_df['parameter'] == param]
                #fig = make_subplots(specs=[[{"secondary_y": True}]])
                for user, color in color_dict.items():
                    #fig = make_subplots(specs=[[{"secondary_y": True}]])
                    user_data = param_data[param_data["user_id"]== user]
                    
                    colors = np.random.rand(1,255)
                    fig.add_trace(
                        go.Scatter(
                            x=user_data['timestamp'], 
                            y=user_data['value'],
                            mode='markers', 
                            name=f"{param} - {user}",
                            marker= dict(color=f"rgb({(hash(user) % 255)}, {(hash(user) // 255) % 255}, {(hash(user) // 255 // 255) % 255})"),#dict(color =color_dict),
                            #color=user_data['value'],
                            text=user_data["user_id"],
                            hovertemplate="Utilisateur: %{text}<br>Valeur: %{y}<br>Date: %{x}",
                            #template="plotly_white",
                            # - User {user}",#param,
                            ),
                            secondary_y=False,
                        row=i , col=1
                        ),
                    #add area chart of h_data values 
                    fig.add_trace(
                        go.Scatter(
                            x=h_data['timestamp'],
                            y=h_data['value'],
                            name="2eme axe",
                            fill="tonexty",
                            ),
                        secondary_y=True,
                        row=i , col=1
                        ),
                    
                    
                        # Add USL and LSL lines if available
                if not param_data["USL"].isna().all():
                    fig.add_hline(y=param_data["USL"].dropna().iloc[0], line_dash="dash", line_color="red", row=i, col=1, annotation_text="USL")
                if not param_data["LSL"].isna().all():
                    fig.add_hline(y=param_data["LSL"].dropna().iloc[0], line_dash="dash", line_color="blue", row=i, col=1, annotation_text="LSL") 
                    
            fig.update_layout(height=300 * len(selected_params)) 
            fig.update_layout(plot_bgcolor="white")
            #fig.update_layout(paper_bgcolor="black")
        return dcc.Graph(figure=fig)

expected final result is :

in blue is area chart (H_data here) that i want to plot in my app. green , pink data points are typical paramters i want to scatter plot (1 scatter plot per paramter + area chart)

any help with this ?
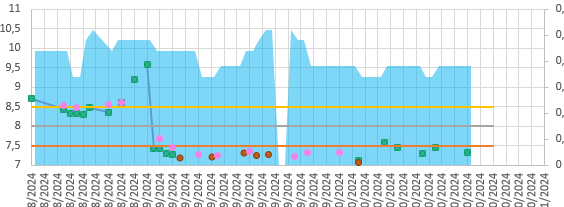
anyone who can help me out with this ?
many thanks

Hi @Lo96. Could you add some data and code to create the base chart and indicate what you want to do? I did not understand the issue.

here is exmaple of dataframe:

timestamp,user_id,product,parameter,value,USL,LSL

2024-11-12 09:12:42.596742,User2,KLORA7,Density,5,

2024-11-12 09:14:08.994729,User2,KLORA7,Density,2,

2024-11-12 09:14:47.923107,User2,KLORA7,Pressure,6,

2024-11-12 11:25:28.389621,User1,KLORA7,Viscosity,3,5,2.36

2024-11-21 09:33:05.001581,User1,KLORA7,PC,4,

2024-11-13 09:24:25.550668,User1,M7-3005,H2O,0.012,

I want to have 1 chart for every paramter (density, pressure, viscosity) and add on the same chart H2O data like in the attached photo in my priori post.

Any ideas for this ?

okay i figured out how to do this. i’m using this code :

df_h2o=df[df['parameter']=='H2O']
paramters=df['parameter'].unique()
paramters=[param for param in paramters if param !='H2O']

param_data={}

for param in paramters: 
    param_data[param]=df[df['parameter'] == param]

for param in param_data:
    fig = px.scatter(param_data[param], x = 'timestamp', y = 'value', 
                     color=px.Constant(param), 
                     labels={'color': 'Parameter'}, 
                     title=f'{param} and H2O over Time')

    #add H2O data 
    fig.add_scatter(x=df_h2o['timestamp'], y = df_h2o['value'], mode= 'markers', name='H2O')

    #update layout 
    fig.update_layout(
                xaxis_title='Timestamp',
        yaxis_title='Value',
        legend_title='Parameter',
        legend=dict(
            x=0,
            y=1,
            traceorder='normal',
            bgcolor='rgba(255, 255, 255, 0)',
            bordercolor='rgba(255, 255, 255, 0)'
        )
    )

but now i want to integrate this in my dash app so that it will be dynamic. Whenever user chooses paramter to visualize , the charts are plotted oe below the other with always H2O data displayed on every chart.

How to integrate this in my dash app. At the moment the vizualisation function looks like this:

@app.callback(
    Output('data-visualization-graphs', 'children'),
    [
        Input('viz-product-dropdown', 'value'),
        Input('viz-parameter-dropdown', 'value')
    ]
)


#vizualisation
def update_visualization(selected_product, selected_params):
    if selected_product and selected_params:
        filename = f"{selected_product}_data.csv"
        if os.path.exists(filename):
            df = pd.read_csv(filename)
            df['timestamp'] = pd.to_datetime(df['timestamp'])

            # Filter the data based on selected parameters
            filtered_df = df[df['parameter'].isin(selected_params)]
            print("filtered df", filtered_df)
            fig=make_subplots(rows=len(selected_params), cols=1, subplot_titles=[f"Evolution de {param}" for param in selected_params])
            color_dict={"User1":"red","User2":"blue","User3":"green"}
                #for user, color in color_dict.items():
            # Create a figure with subplots for each parameter selected
            #fig = go.Figure()
            
            h2o_data=df[df['parameter'] == 'H2O'] # filter H2O data 
            print("h2O DATA HERE", h2o_data)
            for i, param in enumerate(selected_params, start=1):
                param_data = filtered_df[filtered_df['parameter'] == param]
                #fig = make_subplots(specs=[[{"secondary_y": True}]])
                for user, color in color_dict.items():
                    #fig = make_subplots(specs=[[{"secondary_y": True}]])
                    user_data = param_data[param_data["user_id"]== user]
                    
                    colors = np.random.rand(1,255)
                    fig.add_trace(
                       
                        go.Scatter(
                            x=user_data['timestamp'], 
                            y=user_data['value'],
                            mode='markers', 
                            name=f"{param} - {user}",
                            marker= dict(color=f"rgb({(hash(user) % 255)}, {(hash(user) // 255) % 255}, {(hash(user) // 255 // 255) % 255})"),#dict(color =color_dict),
                            #color=user_data['value'],
                            text=user_data["user_id"],
                            hovertemplate="Utilisateur: %{text}<br>Valeur: %{y}<br>Date: %{x}",
                            ),
                            secondary_y=False,
                        row=i , col=1
                        ),
   
                        # Add USL and LSL lines if available
                if not param_data["USL"].isna().all():
                    fig.add_hline(y=param_data["USL"].dropna().iloc[0], line_dash="dash", line_color="red", row=i, col=1, annotation_text="USL")
                if not param_data["LSL"].isna().all():
                    fig.add_hline(y=param_data["LSL"].dropna().iloc[0], line_dash="dash", line_color="blue", row=i, col=1, annotation_text="LSL") 
                    
            fig.update_layout(height=300 * len(selected_params)) 
            fig.update_layout(plot_bgcolor="white")
        return dcc.Graph(figure=fig)

still having same issue , any help with this ?

any recommendations on how to do this ?

Hey @Lo96 what exactly is the question?