Hello Everyone,
Myself Sruthin. I have been working on the Dash library for one month for building the dashboard for my application using Python.
I have been facing one issue for few days.
I need help with my issue, if anyone can give a solution for this problem, it would be very helpful for me.!
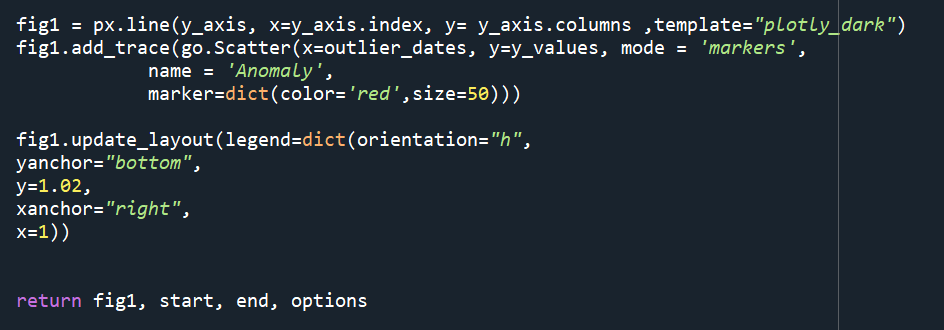
In the below code, i was adding a scatter plot trace to the line graph of Plotly express.
I don’t know what is the mistake in the code, only line graph is visualized in the final output graph, but not the scatter plots
The below graph represents the final graph that I wanted, but the only line graph is visualized but not those scatter points.
But when I use the same data to plot the graph using Plotly but not dash, I’m getting the final graph.
So the main problem here is with the Dash. Can anyone figure out what was the problem for using the code in Dash, why can’t get the graph in Dash?

Any help is highly appreciated
Thanks in advance