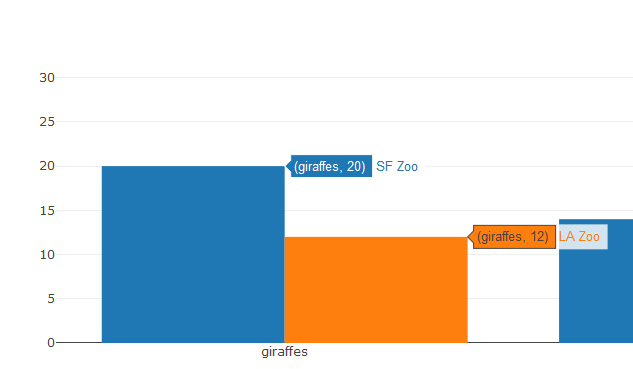
I want to trigger hover programmatically in a grouped bar chart.
Here is my CodePen https://codepen.io/bboughton/pen/dybVVmo
- When I trigger using Plotly.Fx.hover and mimic the same curve # and points the hover looks different. I’d like it to look exactly as if I am hovering with mouse. But they seem to look different. How can I fix this?
- Is there a way to trigger hover by category? E.g. ‘giraffes’ ? I was hoping something like
{curveNumber:0, xaxis: 'giraffes'}might work but not so.


Cheers,
Ben