Happy to share a simple package that I just created, which allows you to highlight values in AgGrid tables using any of the available Plotly color scales. Currently available:
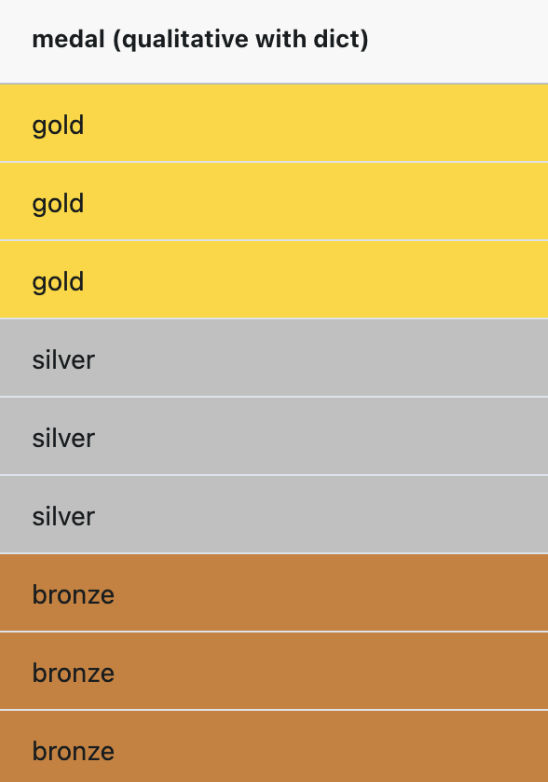
- qualitative
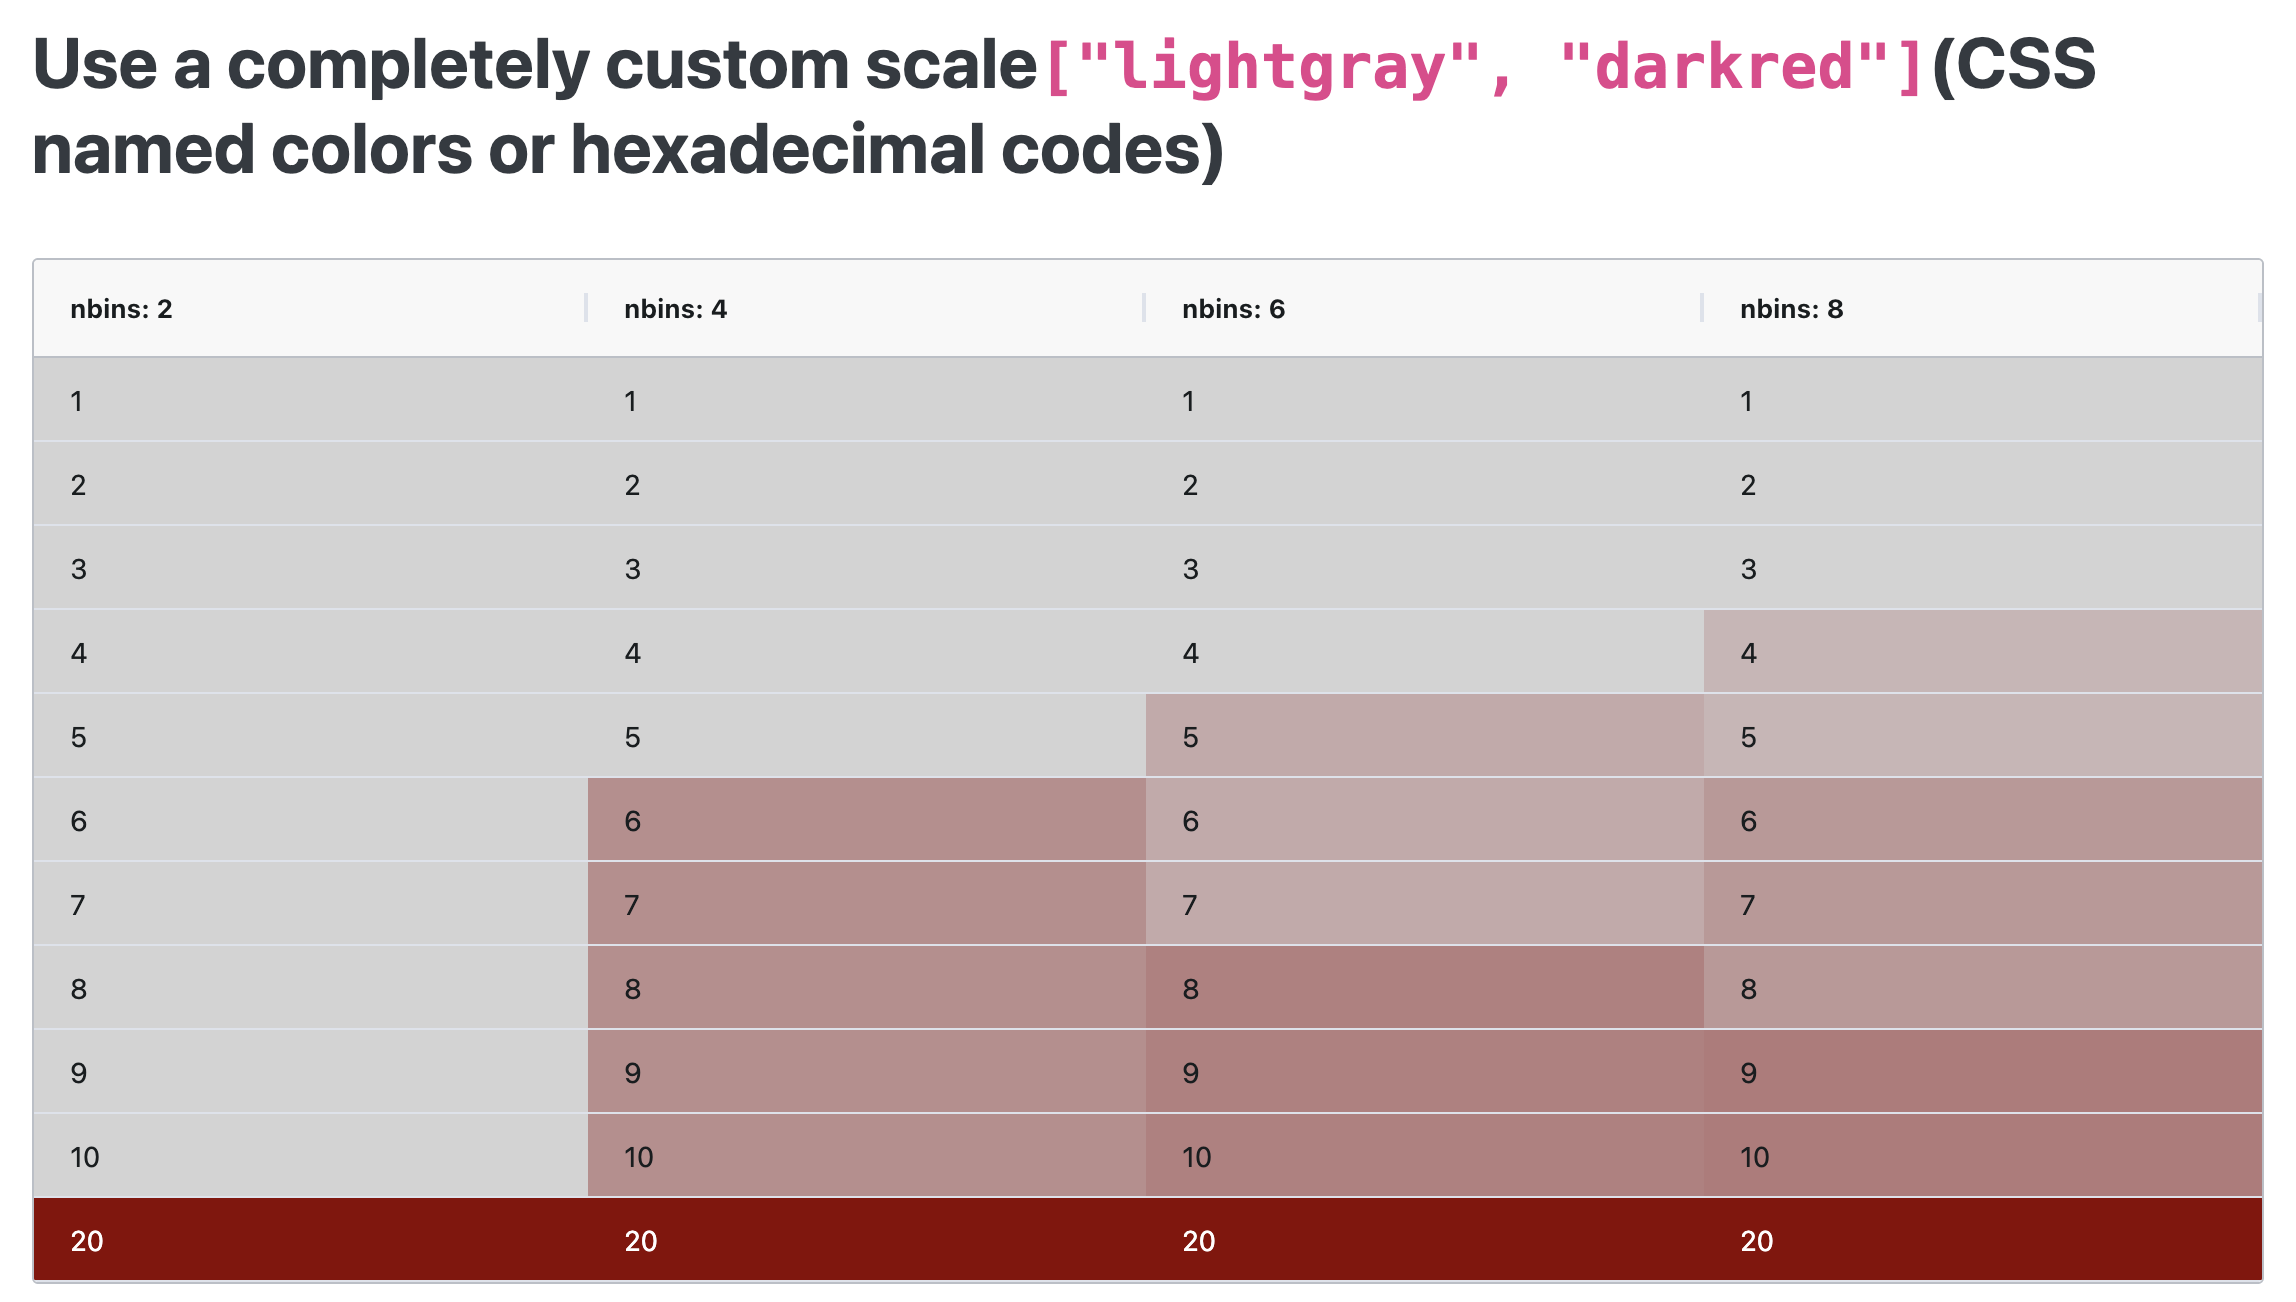
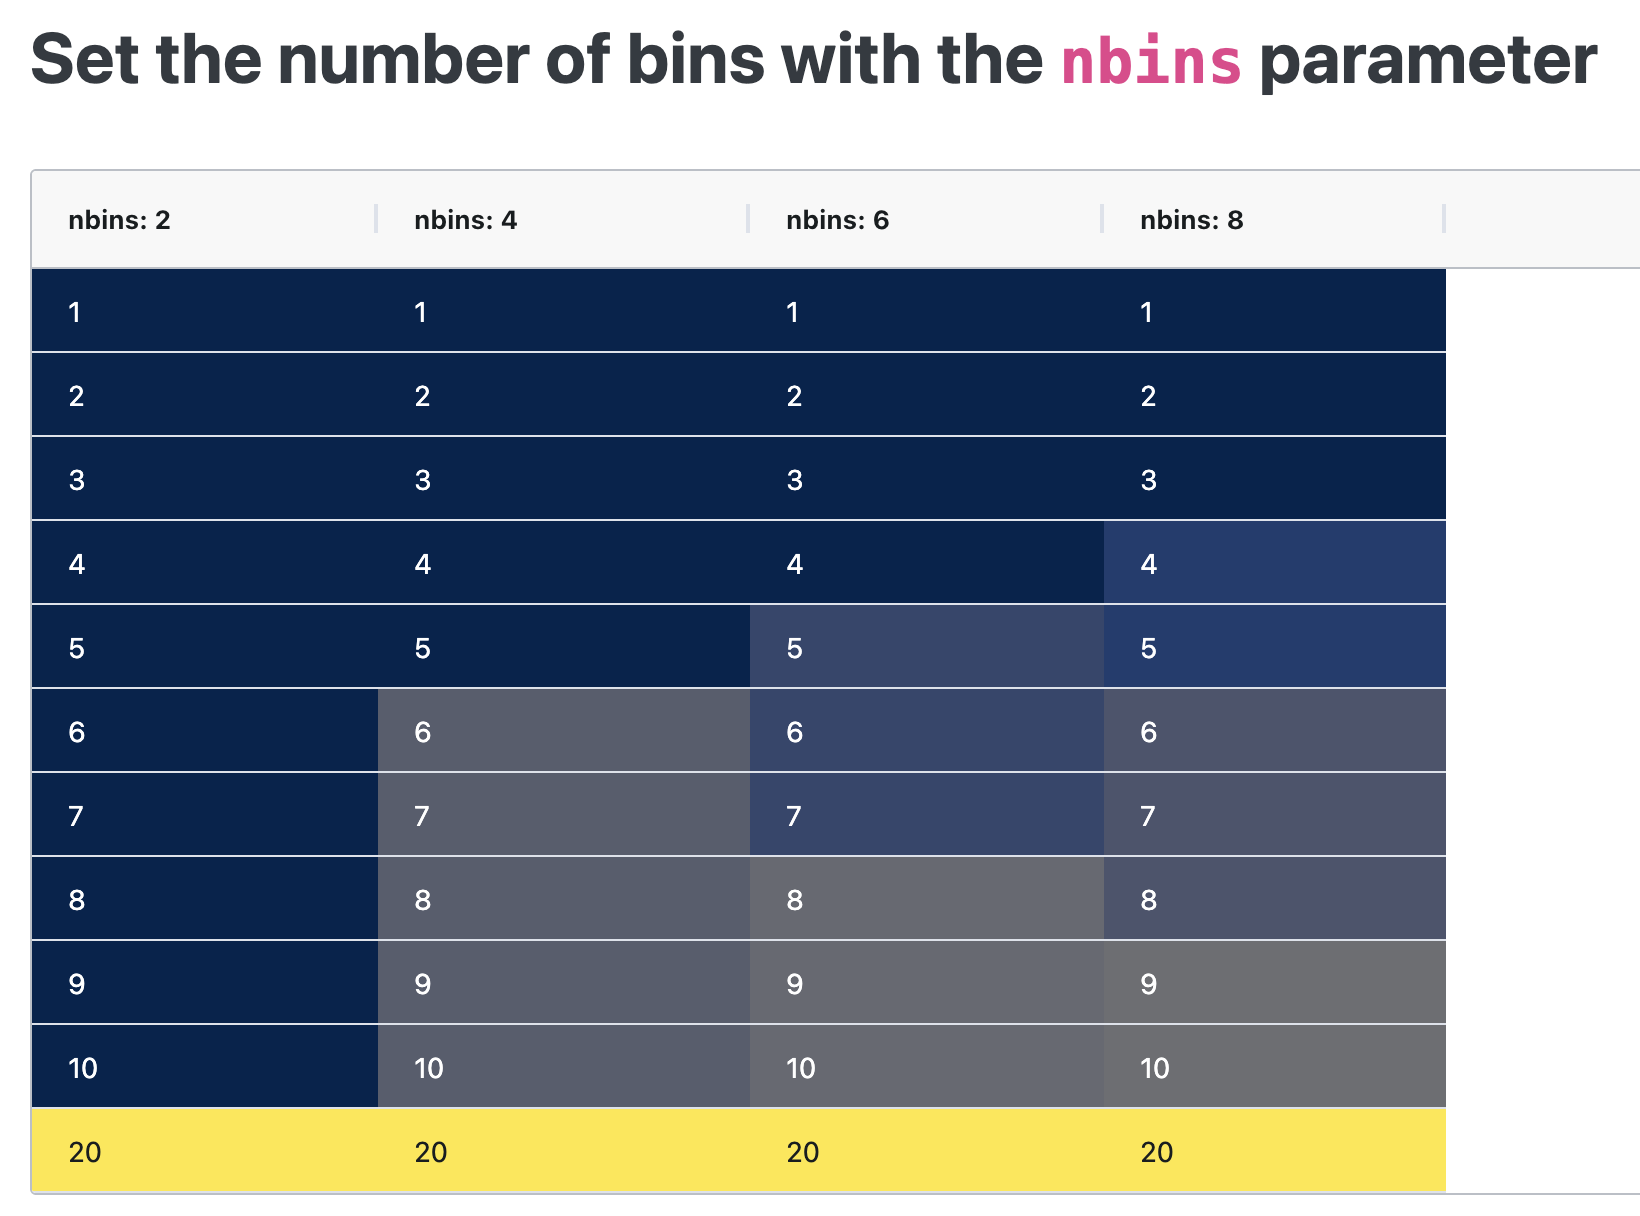
- sequential
- diverging
- bar (bar charts, not really a color scale)
Todo: Add cyclical, and diverging scales
- Interactive app to play with various options: Dash
- Repo: https://github.com/eliasdabbas/dash-aggrid-scales


How to use:
from dash import Dash, html
import dash_aggrid_scales as das
from dash_ag_grid import AgGrid

app = Dash()

app.layout = html.Div([

AgGrid(
   rowData=df.to_dict("records"),
    columnDefs=[
        {
            "field": "nation",
            "cellStyle": {"styleConditions": das.qualitative(medals["nation"])},
        },
        {
            "field": "medal",
            "headerName": "medal (qualitative)",
            "cellStyle": {"styleConditions": das.qualitative(medals["medal"], colorscale="Safe")},
        },
        {
            "field": "count",
            "headerName": "count (sequential)",
            "cellStyle": {"styleConditions": das.sequential(medals["count"], colorscale='cividis')},
        },
        {
            "field": "count",
            "cellStyle": {"styleConditions": das.bar(medals["count"])},
        },
    ])
])
The approach for colorscales was taken and adapted form the official docs, for the bar chart I adapted the approach of @AnnMarieW . Thanks!
Please let me know if you have any suggestions.