✨ Create your data app within minutes with
Plotly Studio
Plotly Community Forum
Plotly can Line Charts add 2 point Marker mode?
📊 Plotly Python
ginoliu2018
January 19, 2022, 10:01am
1
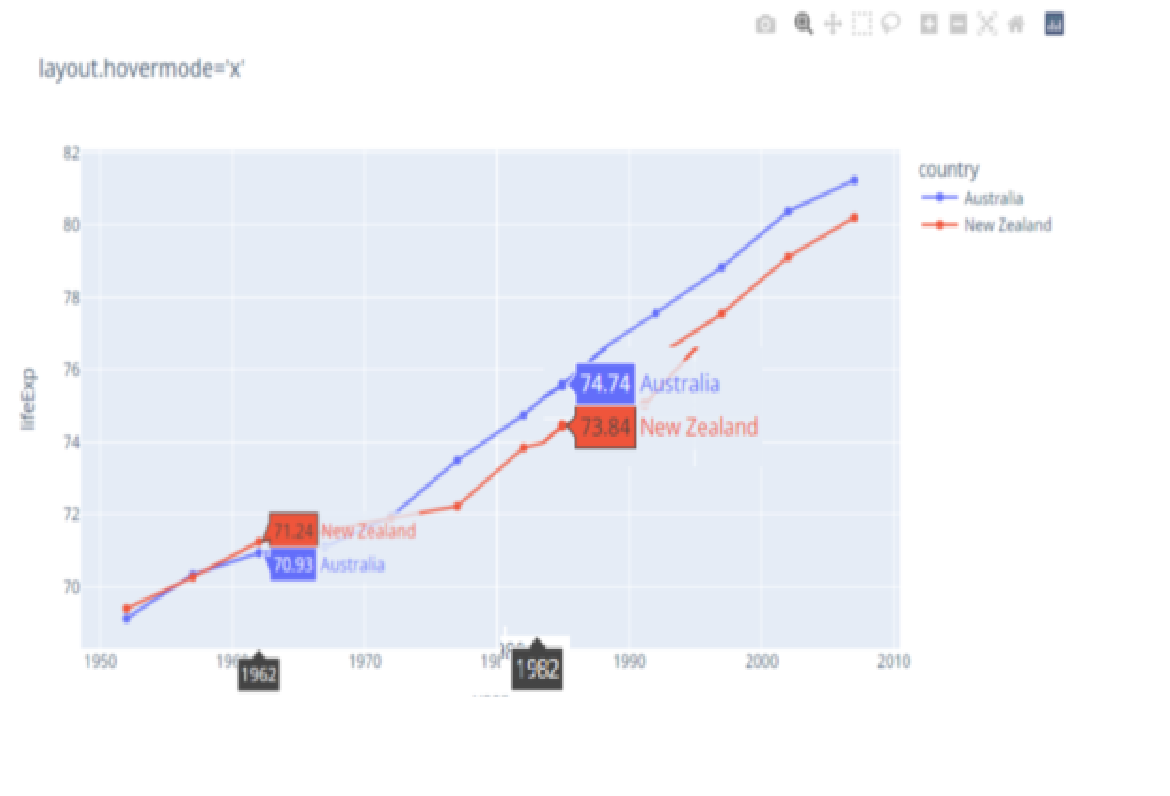
plotly can Line Charts add 2 point Marker mode? like picture Schematic.
2Marker
1170×796 46.4 KB
Related topics
Topic
Replies
Views
Activity
Clarification on marker+dots line graph
📊 Plotly Python
2
1718
December 23, 2019
How to add points on the scatter line with plotly graph_objects
📊 Plotly Python
2
8766
March 31, 2023
Markers in a line plot with Plotly Dash
📊 Plotly Python
question
6
196
November 13, 2024
How to display single points with line trace?
📊 Plotly Python
3
6699
October 15, 2018
Plotting lines+markers Angular JS
plotly.js
5
1152
February 13, 2018