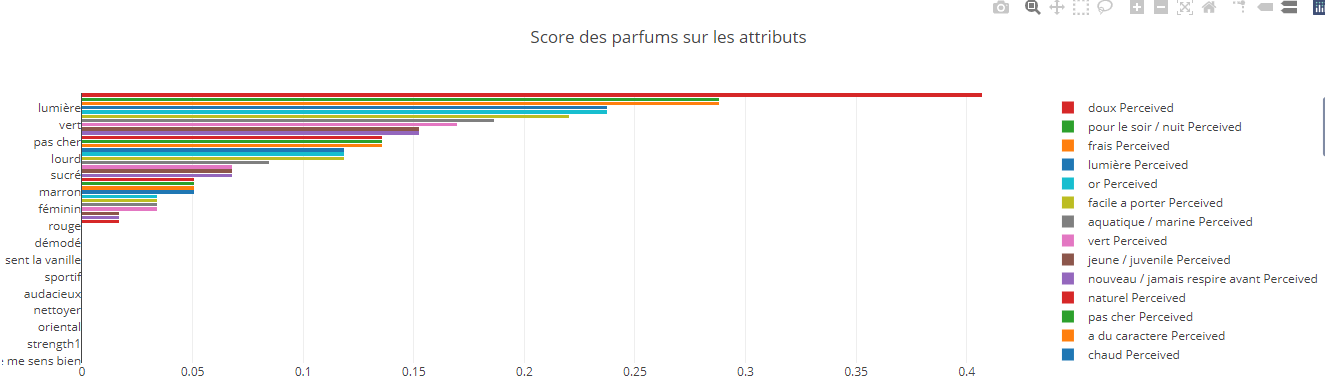
I have a bar chart with bars that I would like to enlarge just enough to have their labels/tickers at the right place. That is to say in the middle of the base of the bar. For the moment only a few of them are visible and we can’t say if they are really aligned.
You can see it live on this website (click on the right tab).
I know from the doc that I can do it by hand with:
fig = go.Figure(data=[go.Bar(
    x=[1, 2, 3, 5.5, 10],
    y=[10, 8, 6, 4, 2],
    width=[0.8, 0.8, 0.8, 3.5, 4] # customize width here
)])
But I would like it to be automatic. So I tried figure.update_traces(marker_line_width=1.5):
But it stays the same.
Here is the related code:
def update_graph(my_dropdown):
    dfc = df.sort_values(by='perceived_benefit', ascending=True)
    traces = []
    for i in range(len(dfc)):
        if dfc.iloc[i].name == my_dropdown:
            trace_claimed = go.Bar(y=[dfc.iloc[i].values[0]], x=[dfc.iloc[i].values[2]],
                                   name= dfc.iloc[i].values[0] + ' Perceived', orientation='h')
            traces.append(trace_claimed)

    figure = go.Figure(data=traces,
                       layout=go.Layout(title='Score des parfums sur les attributs',
                                        barmode='stack')
                       )
    figure.update_traces(marker_line_width=1.5)

    return figure