 New Feature: Click & Hover Anywhere on Graphs with Plotly 6.7 + Dash 4.4!
Hey everyone,
We’re excited to announce a new interactive feature for dcc.Graph that’s been a popular request from the Dash community.
Starting with Dash 4.4 (using plotly.py 6.7 or plotly.js 3.5.0), graphs can now respond to clicks and hover events anywhere in the plotting area, not just on existing data points.
This allows for a wide range of features, including drawing and annotation tools, measuring distances and placing markers or map pins.
How to enable it:
Add one or both of these to the figure layout:
fig.update_layout(hoveranywhere=True, clickanywhere=True)
Your callbacks continue to use clickData and hoverData just as before.
New event data
When clicking or hovering over empty space, Dash now includes:
xvalsandyvals: the graph coordinates under the cursor.xaxes_id(for example"x"or"x2"): identifies the x-axis that received the event.yaxes_id(for example"y"or"y2"): identifies the y-axis that received the event.
Coming soon: xPixel and yPixel These pixel coordinates will make it possible to position a custom tooltip using dcc.Tooltip anywhere in the plotting area.
Examples:
Click anywhere on figure to draw a line:
from dash import Dash, dcc, Input, Output, Patch, no_update
import plotly.express as px

app = Dash()

fig=px.line()

fig.update_layout(
    title="Click-to-draw polyline",
    clickanywhere=True,
    xaxis=dict(range=[0, 100]),
    yaxis=dict(range=[0, 100]),
)

app.layout = dcc.Graph(id="graph", figure=fig)

@app.callback(
    Output("graph", "figure"),
    Input("graph", "clickData"),
)
def add_point(click):

    if not click:
        return no_update

    if click.get("xvals"):
        x = click["xvals"][0]
        y = click["yvals"][0]
    else:
        return no_update

    patch = Patch()

    patch["data"][0]["x"].append(x)
    patch["data"][0]["y"].append(y)

    return patch


if __name__ == "__main__":
    app.run(debug=True)
Click anywhere to measure the depth (y value)
This app shows the X and Y values at the cursor position. Click on two points anywhere in the figure to see the difference in the Y access (the depth of a drill hole)
This app is based on the sample app from the Plotly.js PR Enable Hover and Click Events Anywhere by alexshoe · Pull Request #7707 · plotly/plotly.js · GitHub
https://codepen.io/Alex-Hsu-the-bashful/full/EayrEyQ
from dash import Dash, dcc, Input, Output, State, Patch, no_update
import dash_mantine_components as dmc
import plotly.graph_objects as go
import numpy as np
import random

app = Dash()


def make_log(n=200):
    depth = np.linspace(0, 100, n)

    v = 50 + np.zeros_like(depth)

    for i, d in enumerate(depth):
        v[i] += (
            np.sin(d * 0.08) * 8
            + np.cos(d * 0.05) * 5
            + (random.random() - 0.5) * 6
        )

        if 30 < d < 55:
            v[i] += 18

        if 70 < d < 85:
            v[i] -= 10

    return depth, np.clip(v, 5, 95)

depth, gamma = make_log()

fig = go.Figure()
fig.add_trace(
    go.Scatter(
        x=gamma,
        y=depth,
        mode="lines",
        line=dict(color="#2563eb", width=2),
        fill="tozerox",
        fillcolor="rgba(37,99,235,0.20)",
        name="DH-001",
        hovertemplate="Depth %{y:.1f} m<br>Gamma %{x:.1f}<extra></extra>",
    )
)
fig.add_trace(
    go.Scatter(
        x=[],
        y=[],
        mode="markers",
        marker=dict(size=10, color="rgba(0,0,0,0)"),
        showlegend=False,
        hovertemplate="Depth %{y:.1f} m<br>Gamma %{x:.1f}<extra></extra>",
    )
)
fig.update_layout(
    title="Drill Hole Cross Section Explorer",
    hoveranywhere=True,
    clickanywhere=True,
    hovermode="closest",
    paper_bgcolor="white",
    plot_bgcolor="white",
    margin=dict(l=60, r=20, t=50, b=40),
    height=700,
    xaxis=dict(title="Gamma", range=[0, 100]),
    yaxis=dict(title="Depth (m)", autorange="reversed"),
    showlegend=False,
)


app.layout = dmc.MantineProvider([
    dcc.Store(id="state", data={"p1": None, "p2": None}),
    dmc.Group(
        [
            dmc.Stack(
                children=[
                    dmc.Card(
                        withBorder=True,
                        children=[
                            dmc.Text("Cursor Position", fw=600),
                            dmc.Text(id="cursorx"),
                            dmc.Text(id="cursory"),
                        ],
                    ),
                    dmc.Card(
                        withBorder=True,
                        children=[
                            dmc.Text("Ruler", fw=600),
                            dmc.Text("Click two points to measure the depth interval. Click again to reset.", size="sm"),
                            dmc.Box(id="ruler"),
                        ],
                    ),
                ],
                w=200,
                mt="xl"
            ),
            dmc.Card(dcc.Graph(id="graph", figure=fig), withBorder=True),
        ],
        align="flex-start",
        m="lg"
    )
])

@app.callback(
    Output("state", "data"),
    Input("graph", "clickData"),
    State("state", "data"),
    prevent_initial_call=True,
)
def click(click, state):

    if click.get("points"):
        x = click["points"][0]["x"]
        y = click["points"][0]["y"]
    else:
        x = click["xvals"][0]
        y = click["yvals"][0]

    p = {"x": float(x), "y": float(y)}

    if state["p1"] is None:
        state["p1"] = p
        return state

    if state["p2"] is None:
        state["p2"] = p
        return state

    return {"p1": p, "p2": None}


@app.callback(
    Output("graph", "figure"),
    Input("state", "data"),
)
def draw(state):

    patch = Patch()
    patch["layout"]["shapes"] = []

    def add(p):
        patch["data"][1]["x"].append(p["x"])
        patch["data"][1]["y"].append(p["y"])

        patch["layout"]["shapes"].append(
            dict(
                type="circle",
                xref="x",
                yref="y",
                x0=p["x"] - .15,
                x1=p["x"] + .15,
                y0=p["y"] - .15,
                y1=p["y"] + .15,
                fillcolor="#ef4444",
                line=dict(color="#ef4444"),
            )
        )

    if state["p1"]:
        add(state["p1"])
    if state["p2"]:
        add(state["p2"])

    if state["p1"] and state["p2"]:
        patch["layout"]["shapes"].append(
            dict(
                type="line",
                x0=state["p1"]["x"],
                y0=state["p1"]["y"],
                x1=state["p2"]["x"],
                y1=state["p2"]["y"],
                line=dict(color="#ef4444", width=2),
            )
        )
    return patch


@app.callback(
    Output("ruler", "children"),
    Input("state", "data"),
)
def display(store):
    p1 = store.get("p1")
    p2 = store.get("p2")
    if not p1:
        return ""
    p1_txt = f"Point 1: ({p1['x']:.1f}, {p1['y']:.1f})"
    if not p2:
        return dmc.Alert(p1_txt, variant="light", color="gray", mt="lg")
    d = abs(p2["y"] - p1["y"])
    return dmc.Alert( f"Distance: {d:.2f} m", variant="light", color="gray", mt="lg")


@app.callback(
    Output("cursorx", "children"),
    Output("cursory", "children"),
    Input("graph", "hoverData"),
)
def cursor(hover):
    if not hover or not hover.get("xvals"):
        return "Gamma: --", "Depth: --"
    return f"Gamma: {hover['xvals'][0]:.1f}", f"Depth: {hover['yvals'][0]:.1f} m"


if __name__ == "__main__":
    app.run(debug=True)
Adding points to a map and distance between 2 points
Shows lat lon of points and measures the distance between them
from dash import Dash, dcc, Input, Output, State
import dash_mantine_components as dmc
import plotly.graph_objects as go
import math

app = Dash()


def haversine(p1, p2):
    lon1, lat1 = p1["lon"], p1["lat"]
    lon2, lat2 = p2["lon"], p2["lat"]

    dlat = math.radians(lat2 - lat1)
    dlon = math.radians(lon2 - lon1)

    a = (
        math.sin(dlat / 2) ** 2
        + math.cos(math.radians(lat1))
        * math.cos(math.radians(lat2))
        * math.sin(dlon / 2) ** 2
    )

    c = 2 * math.atan2(math.sqrt(a), math.sqrt(1 - a))
    return 6371 * c


def make_figure(p1=None, p2=None):
    fig = go.Figure()

    # Invisible trace to enable hover/click interactions
    fig.add_trace(
        go.Scattermap(
            lon=[],
            lat=[],
            mode="markers+text",
            marker=dict(size=10, color="rgba(0,0,0,0)"),
            hovertemplate=(
                "Lon=%{lon:.5f}<br>"
                "Lat=%{lat:.5f}"
                "<extra></extra>"
            ),
            showlegend=False,
        )
    )

    # Selected points
    if p1:
        lons = [p1["lon"]]
        lats = [p1["lat"]]

        if p2:
            lons.append(p2["lon"])
            lats.append(p2["lat"])

        fig.add_trace(
            go.Scattermap(
                lon=lons,
                lat=lats,
                mode="markers",
                marker=dict(size=12, color="red"),
                hovertemplate=(
                    "Lon=%{lon:.5f}<br>"
                    "Lat=%{lat:.5f}"
                    "<extra></extra>"
                ),
                showlegend=False,
            )
        )

    # Measurement line
    if p1 and p2:
        fig.add_trace(
            go.Scattermap(
                lon=[p1["lon"], p2["lon"]],
                lat=[p1["lat"], p2["lat"]],
                mode="lines",
                line=dict(width=3, color="red"),
                showlegend=False,
                hoverinfo="skip"
            )
        )

    fig.update_layout(
        title="Map Ruler (click 2 points, click again to clear)",
        clickanywhere=True,
        hoveranywhere=True,
        uirevision="keep",
        height=700,
        margin=dict(l=0, r=0, t=40, b=0),
        map=dict(
            style="open-street-map",
            center=dict(lat=39, lon=-98),
            zoom=4,
        ),
    )
    return fig


app.layout = dmc.MantineProvider(
    dmc.Container(
        [
            dcc.Graph(
                id="graph",
                figure=make_figure(),
            ),
            dcc.Store(
                id="points",
                data={"p1": None, "p2": None},
            ),
            dmc.Card(
                mt="md",
                withBorder=True,
                children=[
                    dmc.Text("Measurement", fw=600),
                    dmc.Text(id="p1", children="Point 1: --"),
                    dmc.Text(id="p2", children="Point 2: --"),
                    dmc.Text(id="dist", children="Distance: --"),
                ],
            ),
        ],
        fluid=True,
        py="md",
    )
)


@app.callback(
    Output("points", "data"),
    Input("graph", "clickData"),
    State("points", "data"),
    prevent_initial_call=True,
)
def update_points(click, store):
    if not click:
        return store

    # Existing marker clicked
    if click.get("points"):
        p = click["points"][0]
        lon = float(p["lon"])
        lat = float(p["lat"])

    # clickanywhere payload
    elif click.get("xvals"):
        lon = float(click["xvals"][0])
        lat = float(click["yvals"][0])

    else:
        return store

    new = {"lon": lon, "lat": lat}

    # First click
    if store["p1"] is None:
        return {"p1": new, "p2": None}

    # Second click
    if store["p2"] is None:
        return {"p1": store["p1"], "p2": new}

    # Third click clears
    return {"p1": None, "p2": None}


@app.callback(
    Output("graph", "figure"),
    Input("points", "data"),
)
def update_figure(store):
    return make_figure(store["p1"], store["p2"])


@app.callback(
    Output("p1", "children"),
    Output("p2", "children"),
    Output("dist", "children"),
    Input("points", "data"),
)
def update_panel(store):
    p1 = store["p1"]
    p2 = store["p2"]

    if not p1:
        return (
            "Point 1: --",
            "Point 2: --",
            "Distance: --",
        )

    p1_txt = f"Point 1: ({p1['lon']:.5f}, {p1['lat']:.5f})"

    if not p2:
        return p1_txt, "Point 2: --", "Distance: --"

    p2_txt = f"Point 2: ({p2['lon']:.5f}, {p2['lat']:.5f})"

    km = haversine(p1, p2)

    return (
        p1_txt,
        p2_txt,
        f"Distance: {km:.2f} km",
    )


if __name__ == "__main__":
    app.run(debug=True)
Subplots Example
Because Dash 4.4 passes xaxes_id and yaxes_id, you can pinpoint which specific subplot was clicked or hovered over.
Here is a simple example with two side-by-side subplots. Clicking anywhere on either chart drops a red target circle into only that specific subplot.
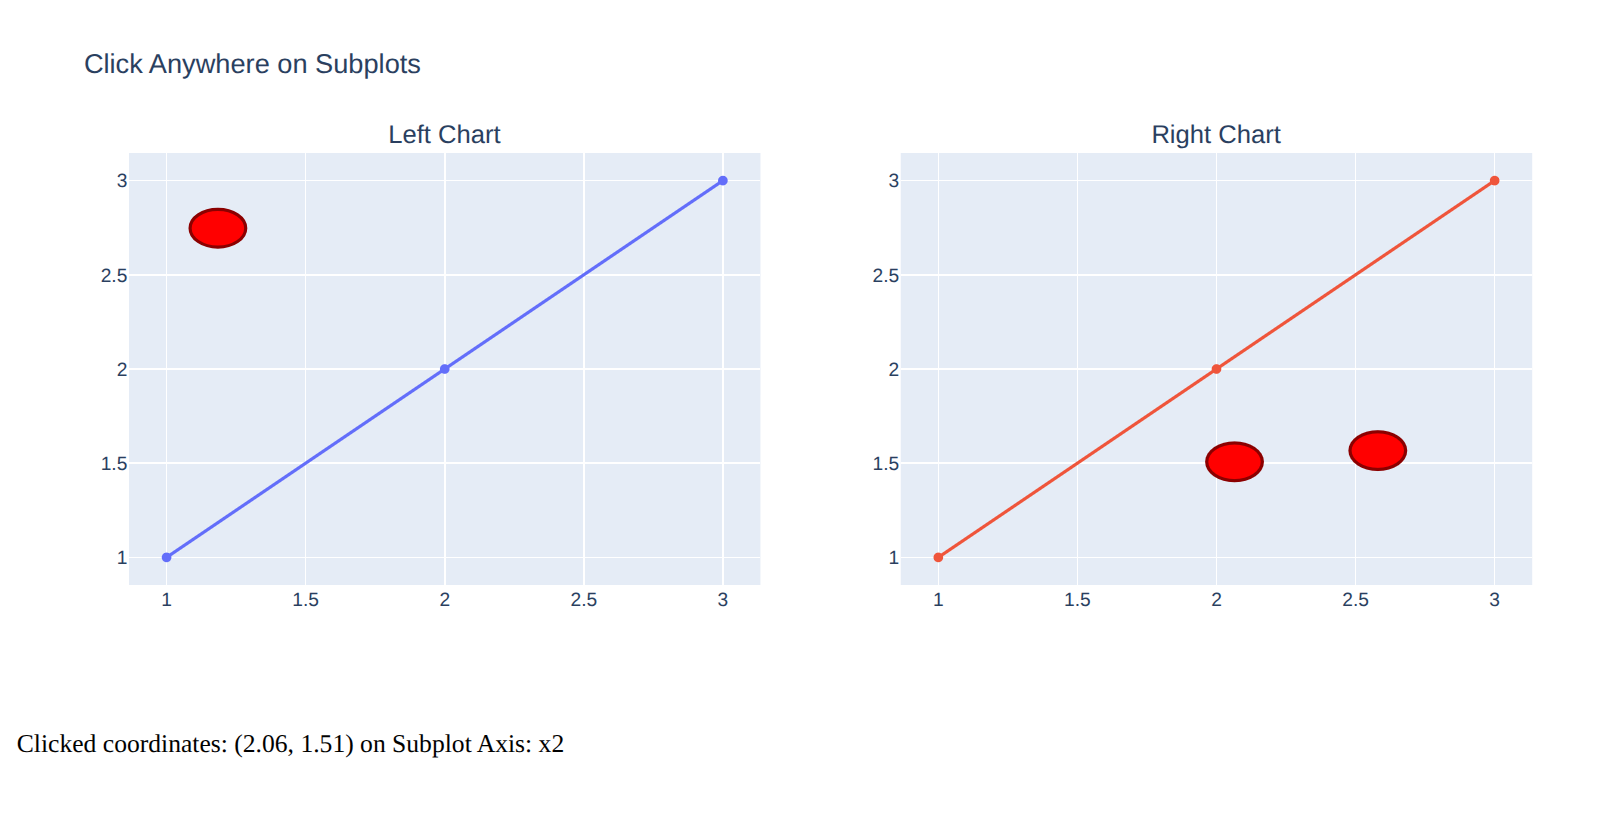
from dash import Dash, dcc, html, Input, Output, Patch, no_update
from plotly.subplots import make_subplots
import plotly.graph_objects as go

app = Dash()


fig = make_subplots(rows=1, cols=2, subplot_titles=("Left Chart", "Right Chart"))

fig.add_trace(go.Scatter(x=[1, 2, 3], y=[1, 2, 3], name="Left Data"), row=1, col=1)
fig.add_trace(go.Scatter(x=[1, 2, 3], y=[1, 2, 3], name="Right Data"), row=1, col=2)

fig.update_layout(
    clickanywhere=True, title_text="Click Anywhere on Subplots", showlegend=False
)

app.layout = html.Div(
    [
        dcc.Graph(id="subplot-graph", figure=fig),
        html.Div(id="click-info", style={"padding": "10px", "fontSize": "16px"}),
    ]
)


@app.callback(
    Output("subplot-graph", "figure"),
    Output("click-info", "children"),
    Input("subplot-graph", "clickData"),
)
def add_marker_to_subplot(click):
    if not click or "xvals" not in click:
        return no_update, "Click anywhere on the charts!"

    # Get the coordinates from the click event
    x = click["xvals"][0]
    y = click["yvals"][0]

    # Extract the exact axis IDs
    xaxes_id = click.get("xaxes_id")  # e.g., 'x' or 'x2'
    yaxes_id = click.get("yaxes_id")  # e.g., 'y' or 'y2'

    # Use Patch to append the shape to the correct subplot axis
    patch = Patch()

    new_shape = dict(
        type="circle",
        xref=xaxes_id,
        yref=yaxes_id,
        x0=x - 0.1,
        x1=x + 0.1,
        y0=y - 0.1,
        y1=y + 0.1,
        fillcolor="red",
        line=dict(color="darkred"),
    )

    patch["layout"]["shapes"].append(new_shape)

    msg = f"Clicked coordinates: ({x:.2f}, {y:.2f}) on Subplot Axis: {xaxes_id}"
    return patch, msg


if __name__ == "__main__":
    app.run(debug=True)
