Coming soon! 
New in Dash 4.5 and Plotly 7
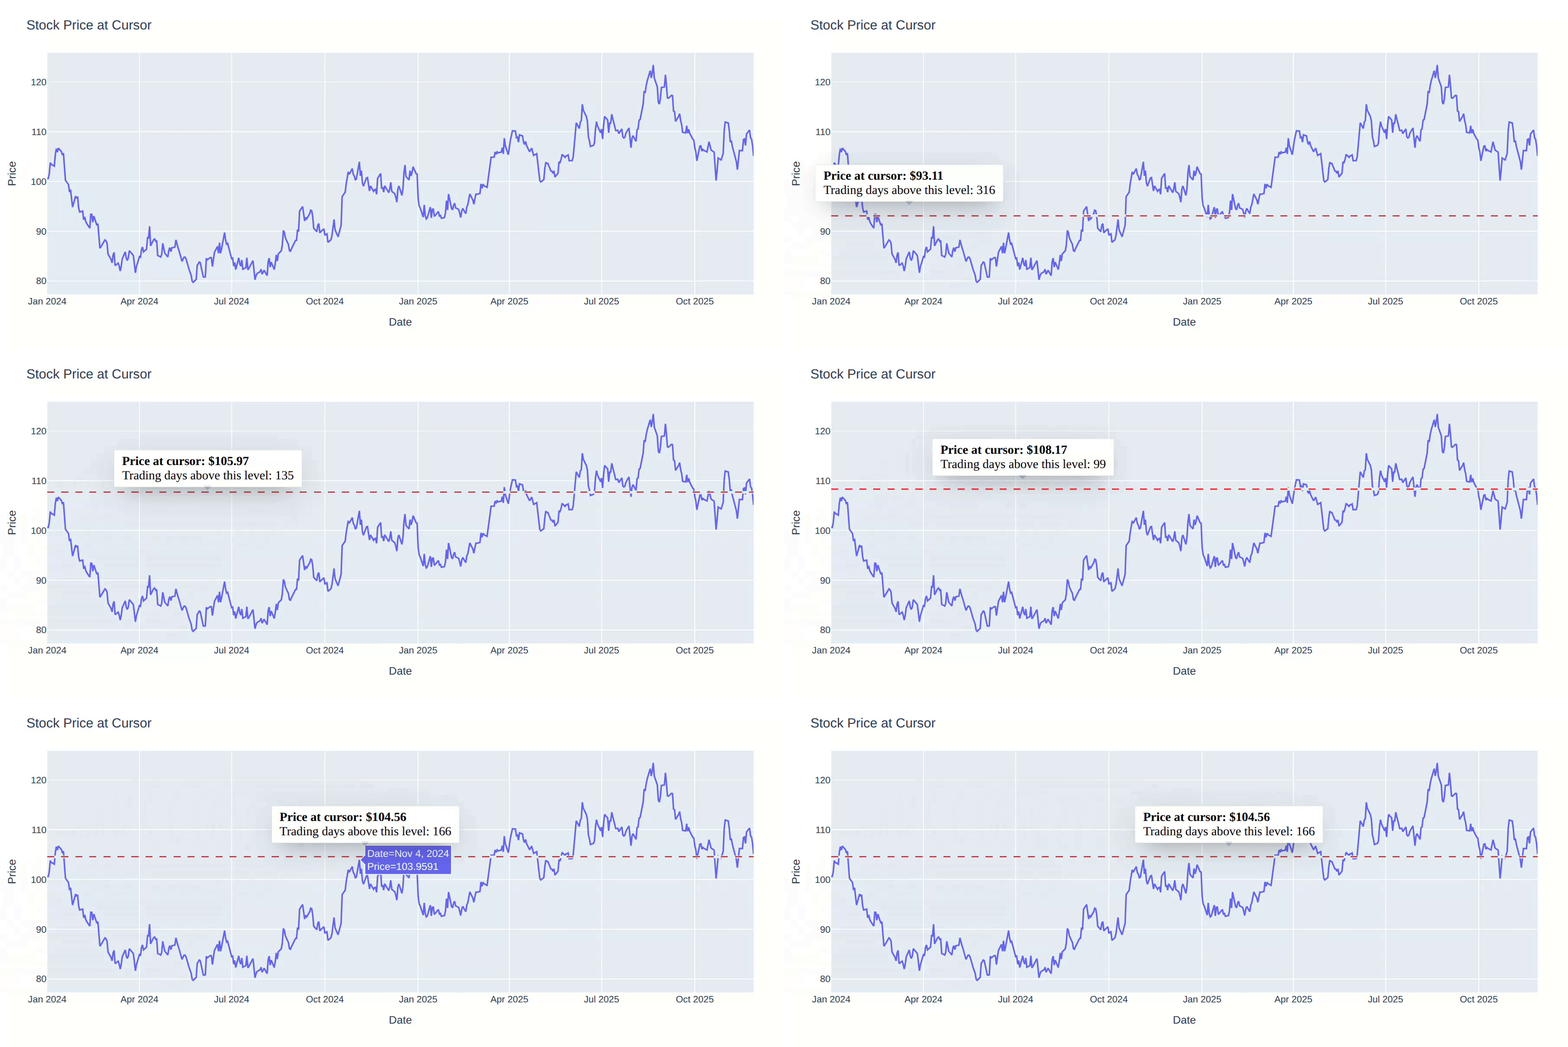
When you add hoveranywhere=True or clickanywhere=True to Plotly figures, you can now get the get the cursor position even when it isn’t directly over a data point. The resulting hoverData or clickData includes both the data coordinates (xvals, yvals) and the pixel coordinates (xPixel, yPixel).
This makes it possible to use dcc.Tooltip to create tooltips that follow the cursor rather than being anchored to a data point.
The example below uses hoveranywhere=True to show the price at the cursor position and calculate how many trading days had a higher price.
# requires dash>=4.5 and plotly>=7

from dash import Dash, dcc, html, Input, Output
import numpy as np
import pandas as pd
import plotly.express as px


app = Dash()

np.random.seed(42)
dates = pd.date_range("2024-01-01", periods=500, freq="B")

price_changes = np.random.normal(0, 1.5, len(dates))
prices = 100 + np.cumsum(price_changes)

df = pd.DataFrame({
    "date": dates,
    "price": prices,
})

fig = px.line(
    df,
    x="date",
    y="price",
    labels={"date": "Date", "price": "Price"},
)

fig.update_layout(
    hoveranywhere=True,
    title="Stock Price at Cursor",
    xaxis=dict(showspikes=False),
    yaxis=dict(
        showspikes=True,
        spikemode="toaxis+across",
        spikesnap="cursor",
        spikecolor="#FF4136",
        spikethickness=1.5,
    ),
)

app.layout = html.Div([
    dcc.Graph(
        id="ha-stock-chart",
        figure=fig,
        clear_on_unhover=True,
        config={"displayModeBar": False},
    ),
    dcc.Tooltip(
        id="ha-tooltip",
        direction="top",
        children=html.Div([
            html.Div(id="ha-tooltip-line1", style={"fontWeight": "bold"}),
            html.Div(id="ha-tooltip-line2"),
        ]),
    ),
])


@app.callback(
    Output("ha-tooltip", "show"),
    Output("ha-tooltip", "bbox"),
    Output("ha-tooltip-line1", "children"),
    Output("ha-tooltip-line2", "children"),
    Input("ha-stock-chart", "hoverData"),
)
def update_tooltip(hover_data):
    if not hover_data:
        return False, {}, None, None

    if not hover_data.get("xPixel"):
        return False, {}, None, None


    price = hover_data["yvals"][0]
    count = (df["price"] > price).sum()

    bbox = {
        "x0": hover_data["xPixel"] - 5,
        "x1": hover_data["xPixel"] + 5,
        "y0": hover_data["yPixel"] - 5,
        "y1": hover_data["yPixel"] + 5,
    }

    return (
        True,
        bbox,
        f"Price at cursor: ${price:.2f}",
        f"Trading days above this level: {count}",
    )


if __name__ == "__main__":
    app.run(debug=True)