With MATLAB we can visualize latitude and longitude data over interactive maps using Geographic Plots. For this, MATLAB provides us with three functions: geoscatter, geoplot, and geobubble.
Using the geoscatter function we can generate Scatter Charts at specific geographic coordinates. While with the geoplot function we can create Plot lines between geographic coordinates. But if we use the geobbule function we can create a geographic bubble chart with filled circles (bubbles) representing specific geographic locations.
I am pleased to tell you that now with fig2plotly we can also get the equivalent versions of these magnificent geographic charts on Plotly! 
It is important to note that fig2plotly gives us the possibility to choose two types of rendering which we can set using an optional parameter called 'geoRenderType'. Among the rendering types we have:
-
'geo'(by default) which is based on D3.js -
'mabox'which is tile-based .'mapbox'is much more powerful in terms of visualization, but it has certain limitations regarding the configuration of markers and texts. The user can now choose the type of rendering they want.
To test I share below two code examples (one for each type of rendering) using the geoplot functionality. However, both examples can be extended to the other two geographic chart functionalities (geoscatter and geobubble). Feel free to recreate these examples. 
geo rendering:
latSeattle = 47.62;
lonSeattle = -122.33;
latAnchorage = 61.20;
lonAnchorage = -149.9;
geoplot([latSeattle latAnchorage],[lonSeattle lonAnchorage])
geolimits([45 62],[-149 -123]);
geobasemap colorterrain;

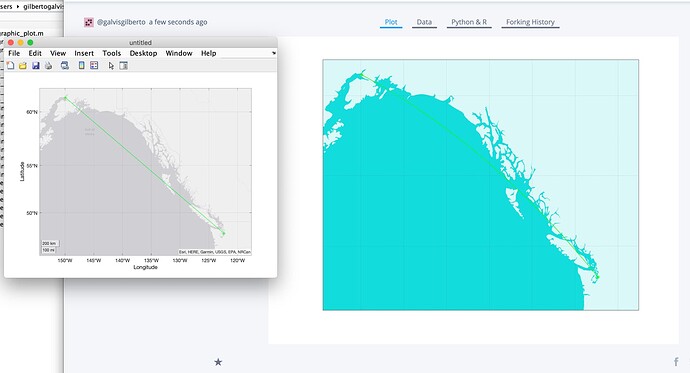
fig2plotly(gcf, 'offline', true, 'geoRenderType', 'geo');
The following screenshot is the result of running the previous example
mapbox rendering:
latSeattle = 47.62;
lonSeattle = -122.33;
latAnchorage = 61.20;
lonAnchorage = -149.9;
geoplot([latSeattle latAnchorage],[lonSeattle lonAnchorage])
geolimits([45 62],[-149 -123]);
geobasemap colorterrain;

fig2plotly(gcf, 'offline', true, 'geoRenderType', 'mapbox');
With which we would obtain the following result
If you want to see the two previous examples directly in Chart-Studio, you can follow the following links: geo rendering and mapbox rendering
I invite you to recreate these examples on your own using the examples provided on this site
I attach below my results for all geographic charts and for each rendering type
geoscatter :
geoplot :
geobubble :


