Using MATLAB we can incredibly plot 3-D surfaces just by entering a mathematical expression given by
z = f(x, y). We can do this using the MATLAB function fsurf.
Now, depending on the mathematical expression that we pass as the input argument in fsurf, MATLAB will show us really interesting 3-D surfaces. But, fig2plotly will go further 

To address the fsurf functionality, you just need to invoke fig2plotly at the end of your MATLAB code and set the optional 'offline' parameter to true or false, depending on the offline/online mode you want to use. Let’s see the following example
r = @(u,v) 2 + sin(7.*u + 5.*v);
funx = @(u,v) r(u,v).*cos(u).*sin(v);
funy = @(u,v) r(u,v).*sin(u).*sin(v);
funz = @(u,v) r(u,v).*cos(v);
fsurf(funx,funy,funz,[0 2*pi 0 pi])
camlight;

fig2plotly(gcf,  'offline',  false); % online mode
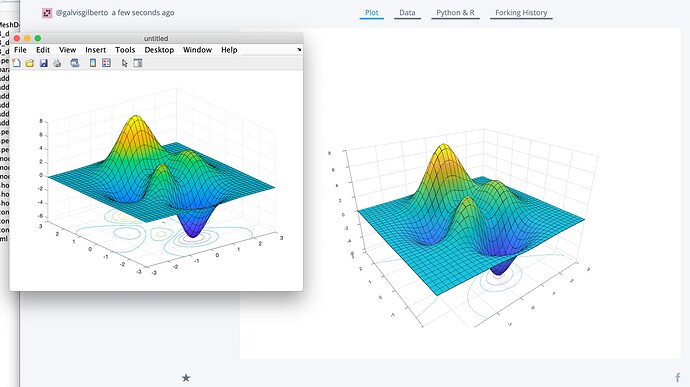
After executing the above code, the charts generated by MATLAB and fig2plotly are shown in the following image.
As we can see, on the left of the screenshot above appears the surface plotted by MATLAB, but on the right we delight in the beauty of Plotly.
Following this link, you will be able to experience this directly in Chart-Studio.
Here you can find more examples using fsurf, which you can recreate using fig2plotly . Please try to do it! I did it and was fascinated again!  I attach below screenshots with results from my end


