Hi all! Just wanted to share a document that I wrote about Load Testing/Stress Testing Dash Apps using a tool called JMeter. I hope you find this helpful!
1 - Purpose of Load Testing
Load testing is a process for testing how a piece of software (in our case, a dash app) performs when subjected to a particular “load” (that is to say, a particular number of users accessing the app over a particular period of time). Some of the metrics identified by load testing include:
- The maximum operating capacity of the app (e.g. how many users can perform a particular action on the app in the span of 1 minute before the app crashes or becomes extremely slow)
- Sustainability of the application at maximum operating capacity (e.g. maybe n users can use the app in the span of 1 minute without serious performance issues, but can the app sustain this repeatedly over the span of an 8 hour work day?)
- Whether the maximum operating capacity is sufficient to support the anticipated load
Load testing should always be completed for any sort of production app (i.e. an app with external users). It ensures that performance limitations are identified prior to app launch, that way adjustments can be made proactively rather than reactively.
2 - Software for Load Testing
There are many pieces of software that can be used for Load Testing. This guide will provide detailed instructions on how to use JMeter, a “tried and true” Load Testing software.
This article gives some other suggestions for possible Load Testing tools.
3 - JMeter for Load Testing
A) Installing JMeter
JMeter is a Java application, so prior to installation you must ensure that you have Java installed on your system:
- Install the latest version of Java SE Development Kit
- Check that it installed correctly by opening a terminal and entering the command java -version
- If nothing displays, re-install Java SE runtime environment
Once Java is installed, download one of the JMeter binaries (either .tgz or .zip) from here. More information on installation can be found in the docs.
B) Running the JMeter GUI
The JMeter GUI is an extremely helpful tool for designing and debugging your Load Tests. To launch the JMeter GUI:
-
cd into the bin directory of the unzipped file.
-
(On Linux/Mac) run the command source jmeter.sh (if that doesn’t work, try ./jmeter.sh)
-
The GUI should launch and look something like this:


By default, JMeter should open up with a blank Test Plan that you can begin adding to.
Some users experience issues saving their files from the GUI, but this issue can be fixed by changing the theme of the GUI to one without noted bugs, such as Nimbus (Options → Look and Feel)
C) Creating a Test Plan
A test plan is a sequence of actions that JMeter will take to simulate users using the app. Broadly, this will involve JMeter sending a specified number of requests to the application in a specified order at a specified frequency, and monitoring how the app responds to each of these requests. For example, a test plan may mimic 25 users loading the app and triggering 2 callbacks, repeated every 2 minutes.
I. Anatomy of an HTTP request
HTTP requests are the types of requests used in Dash Apps, and will be programmed into the test plan. There are many components of an HTTP request, and this article gives a good (and concise) overview of them.
II. Requests in a dash app
In general, it is advised to add a request for every callback that a user would fire when undergoing the actions you are trying to mimic. To figure out which callbacks are fired (as well as the required request data for each callback), open the developer tools window on your browser and navigate to the network tab (this is for chrome, but other browsers should have a similar tab):

In the above screenshot, the app has just been loaded. Each row in the network tab refers to an HTTP request that was performed. In this case, there are three requests: one for dash dependencies, one for loading the layout, and one for the initial run of the callback(s).
If the app is interacted with in another way (e.g. using the top dropdown to update the graph), another callback request will appear in the network tab:

For the purposes of JMeter, only the callback requests need to be included in the test plan.
III. Creating a thread group in JMeter
Before requests can be added to JMeter, we must create a thread group - a group of threads, or requests, that will be sent to the app during the load testing.
This can be created in JMeter by right clicking on the test plan and clicking Add → Threads (Users) → Thread Group

The thread group will look like this:

The three main parameters of interest on this page are:
Number of Threads (users): This is the number of users that JMeter will simulate within the test plan. For example, if you want to test an app against 100 users, you would set this value to be 100
Ramp-up period (seconds): This specifies the interval over which the Threads will be sent to the app. If set to 0, requests will be fired immediately. If set to 100, the requests will be fired evenly over that interval (e.g. 1 request per second for 100 Threads)
Loop Count: How many times the thread group will be repeated.
IV. Adding defaults to the Test Plan
In order for requests to be sent by JMeter, 4 pieces of data need to be sent to JMeter:
- Request method
- Request path
- Request headers
- Request payload
Each time you add a request in JMeter, you will need to specify each of these values. However, some of these values may be the same for all requests, and so a default value can be added. In particular, this applies to Request paths and Request headers
To add a default request path, right click on your test plan and select Add → Config Element → Request Defaults
You can then add the path for your requests to this element. To determine the request path, click on the request from the Network tab on your browser and navigate to the Headers sub-tab. The path will be under the field Request URL

You can then parse the url and add it to the request defaults in JMeter:
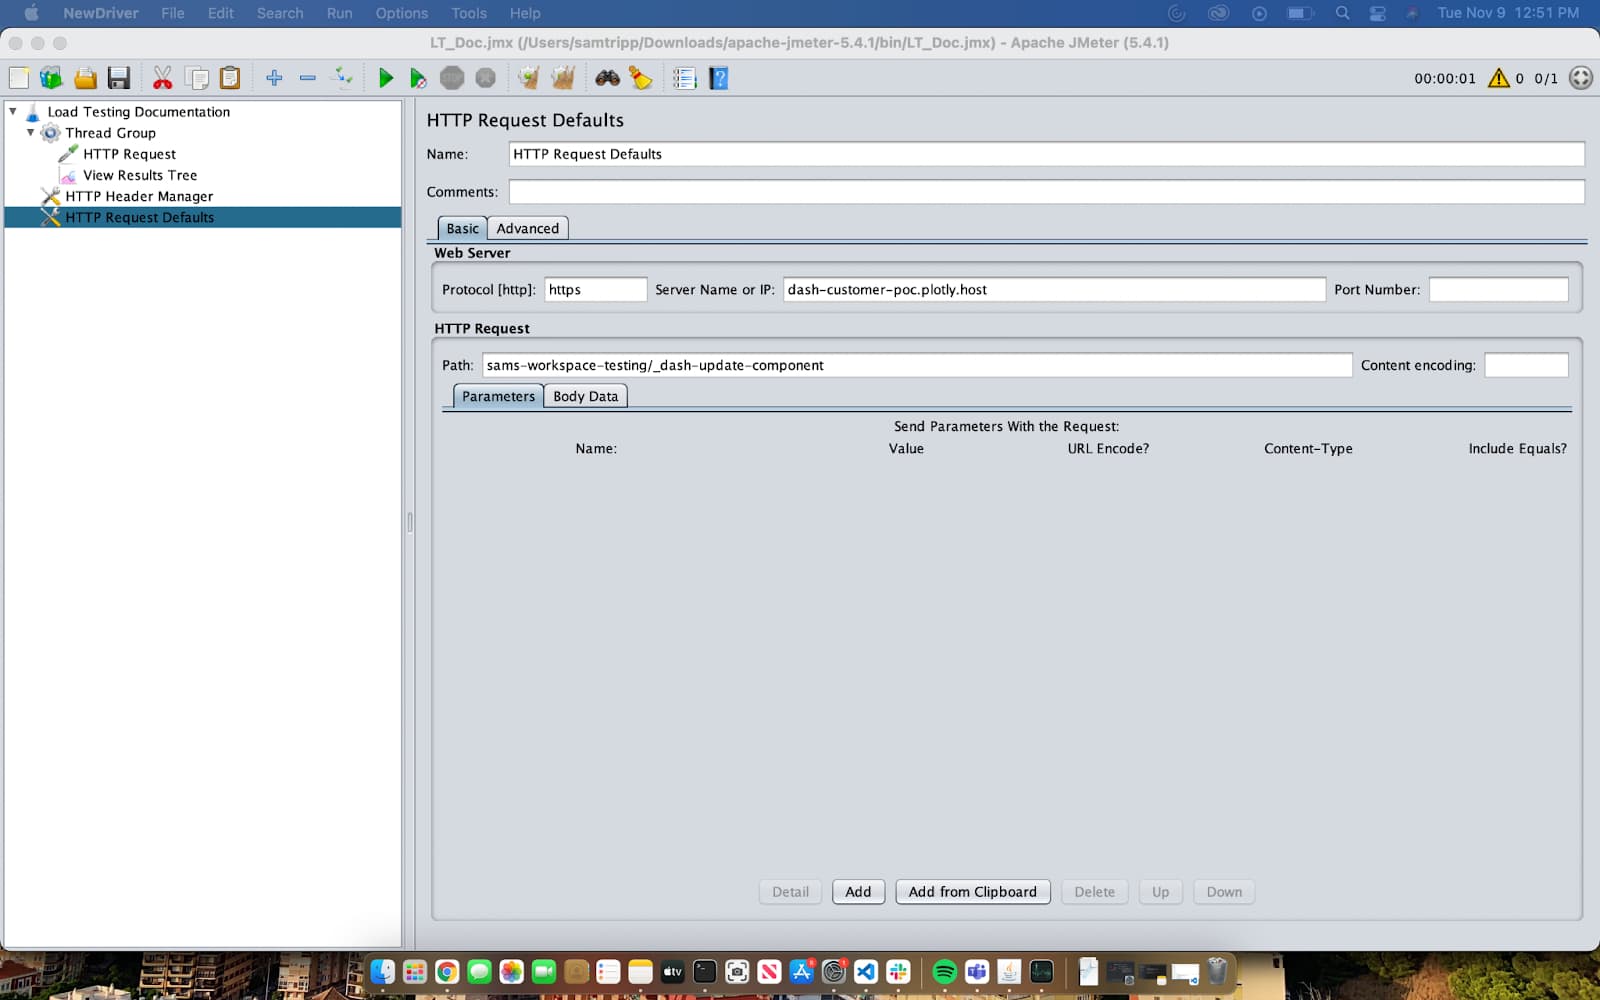
Important: if the protocol in the request is https, make sure to add that in (don’t leave as just http)
To add default headers, right click on your test plan and select Add → Config Element → HTTP Header Manager

You can retrieve the headers from the same spot as the request path (note: click View source to put them in a more copy-paste friendly format).

Copy the headers and paste them into the headers default by selecting Add from Clipboard

V. Adding requests to the Test Plan
To add a request, right click on the Thread Group and select Add → Sampler → HTTP request

Since we’ve already added the headers and the request url, we just need to add the Request Method and the Request Payload.
The Request Method is found underneath the Request URL in the Network Tab, and will (almost) always be POST
The Request Payload is found underneath the Request Headers, and should also be copied in “source” format:

These both can then be added to the request in JMeter:

VI. Adding assertions to requests
When a request finishes, it returns some sort of data. For example, the first callback - which updates the graph based on the default value of the dropdown - will return the data associated with the graph. It is wise to add assertions in JMeter to verify that the response from JMeter’s request matches the expected response.
To add an assertion, right click the request and select Add → Assertions → Response Assertion

Copy the request response data by going to the Response tab on the Network tab:

Add this to JMeter by clicking Add from Clipboard:

VII. Grouping requests
Sometimes it’s helpful to group related requests together. For example, if the app is designed such that three callbacks fire upon page load, it would be helpful to group these three requests together into one “page load action”.
In this case, we can group the initial callback with the callback to select a new item from the dropdown.
To add a request group, right click on the thread group and select Add → Logic Controller → Transaction Controller

You can then drag your requests underneath the group title to add them to the group.
VIII. Adding a listener
Listeners are elements in JMeter that can be used to view the results of running the test plan from within the GUI. This is helpful while building the test plan, as it’s a way of ensuring that you’ve set things up correctly (i.e. correct headers, correct url, etc.)
To add this to JMeter, right click on the test plan and select Add → Listener → View Results Tree

The results of the test plan will appear here once it is run.
IX. Summary
This was an overview of how to make a simple, straightforward test plan in JMeter. Of course, this merely scratched the surface of what JMeter can do. Check out the official JMeter documentation for more details about what can be done on the platform.
D) Running a test plan
- From the GUI
After creating the test plan, it is advisable to test the test plan by running it from the GUI (to make sure everything has been set up correctly).
In JMeter, this is simply done by pressing the green button on the top bar:

The results will then appear in the listener:


The green check marks indicate that both of the requests in the test plan passed, and as such, the request group passed as well. By clicking on each request, you can also view data such as the Load Time, the Response Code and Response Message, and the Body Data.
- From the command line
Once you’re confident that your Test Plan has been set up correctly, the “actual” load testing should be run from the command line. This is because running the GUI itself will interfere with the results.
To run from the command line:
- cd into the directory where your test plan is saved
- (Linux/Mac) run the following command: ./jmeter -n -t {Test_Plan_Name}.jmx -l log.csv
This will run the test plan, and output the results to a file called log.csv. For example:

The output of the spreadsheet looks like this:
| timeStamp | elapsed | label | responseCode | responseMessage | threadName | dataType | success | failureMessage | bytes |
|---|---|---|---|---|---|---|---|---|---|
| 1636551992055 | 821 | Load Page | 200 | OK | Thread Group 1-1 | text | TRUE | 1997 | |
| 1636551992894 | 155 | Update Graph | 200 | OK | Thread Group 1-1 | text | TRUE | 1553 | |
| 1636551991937 | 976 | Load Page and Update Graph | 200 | Number of samples in transaction : 2, number of failing samples : 0 | Thread Group 1-1 | TRUE | 3550 |
| sentBytes | grpThreads | allThreads | URL | Latency | IdleTime | Connect |
|---|---|---|---|---|---|---|
| 1247 | 1 | 1 | https://dash-customer-poc.plotly.host/sams-workspace-testing/_dash-update-component | 814 | 0 | 608 |
| 1269 | 1 | 1 | https://dash-customer-poc.plotly.host/sams-workspace-testing/_dash-update-component | 152 | 0 | 0 |
| 2516 | 1 | 1 | null | 966 | 138 | 608 |
It shows a lot of the same information as the Listener in the GUI, including the Response Code/Message for each request, whether or not the request succeeded, the number of bytes returned from the request, the Latency (i.e. time between sending a request and receiving a response), etc.
When the number of threads increases, it may take longer for a request to receive a response. This can be analyzed using the Latency column to assess how long a response will take for a given thread group, and if this is acceptable.
At a certain level, the server may stop responding, in which case you would expect to see error code 500 in the responseCode column.
Note: when outputting the results of a Test Plan run to a file, if that file already exists, the results will simply be appended to the end of the file. If you prefer to keep the results separate, it is advised to give each file a unique name (e.g. log100threads.csv, log120threads.csv, etc.)
4 - Load testing process
To load test an app, the following general process should be followed:
- Choose a user action / series of user actions on the app that are the most computationally intensive (e.g. loading data, running an analytic on data, generating a report, etc). This will best represent actions that may cause issues when the app experiences heavy user traffic.
- Create a test plan that encompasses these actions.
- Run the test plan with 1 thread in the GUI to make sure it works as expected.
- Adjust the ramp-up time according to the time interval over which users are expected to use the app (e.g. set the ramp up time to 0 if users will instantly be using the app the moment it is released, set it to 1 hour if the users are expected to use it over the course of an hour)
- Run the test plan from the command line
- If the plan passes, increase the number of threads, and repeat step 5. If the plan fails (i.e. receiving error code 500 on requests, or latency is extremely high), this indicates that the maximum load of the app has been surpassed.
Ideally, you want to find the number of threads/users wherein the test plan can be run over and over again without the server crashing or becoming extremely slow. This will indicate the maximum operating capacity of the app.
If the maximum operating capacity of the app is higher than the anticipated traffic, then you can safely say that your app is production ready. If not, the app may need to be modified.
5 - Modifications for apps which fail load testing
This will vary greatly depending on the nature of the application, but the following are some things that can be checked or changed if load testing fails:
- Check to make sure that the number of gunicorn workers is the maximum it can be depending on the number cores on the server. In general, the number of gunicorn workers should be equal to the number of cores on the server minus ~2-4 (some need to be reserved to run the dash enterprise UI, etc.)
- Increase the number of cores on the server (this will cost the customer more $$, but is sometimes necessary)
- Change the way the app is structured:
- If the app ships a lot of data through a dcc.Store, consider caching the data or storing it in a database or file system
- Evaluate and improve callback structure (e.g. are you repeating any computationally intensive callbacks?)
- Cache data (e.g. if the user is viewing the same page multiple times within a session, no need to reload it each time)
6 - Other tools for performance monitoring
Another nice tool that can be used to view memory and CPU usage on the server is HTOP (apt install htop).

HTOP provides a visual representation of the CPU usage on each core of the server, as well as the memory usage from the server. When running a load test, you could also have HTOP open to get a sense of how much the server is being strained by the process.