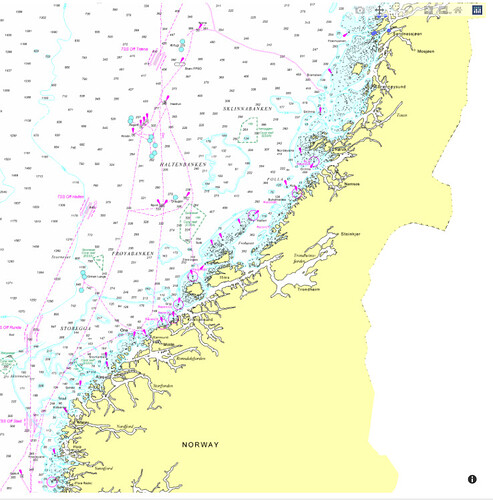
I try to add output from the WMS server to a plotly.scatter_mapbox.
I use 2 different wms services. One of them works great, pulling the image from the server and displaying it on the figure.
fig = px.scatter_mapbox(dfBoatTrack,
lat=dfBoatTrack.lat,
lon=dfBoatTrack.lon)
fig.update_layout(mapbox_style=“open-street-map”)
fig.update_layout(
mapbox_style=“white-bg”,
mapbox_layers=[
{
“sourcetype”: “raster”,
“sourceattribution”: “Government of Norway”,
“source”: [“https://wms.geonorge.no/skwms1/wms.sjokartraster2?service=wms&version=1.3.0&request=GetMap&bbox={bbox-epsg-3857}”
“&transparent=true&width=512&height=512&layers=all&CRS=EPSG:3857&format=image/png”],
“below”: “traces”
}
])
fig.update_geos(fitbounds=“locations”)
fig.update_layout(height=800, width=800, margin={“r”:0,“t”:0,“l”:0,“b”:0})
fig.show()
While another one causes unknown error, so I cannot find the solution and make it work.
It shows only blank map with scatter dots and error message at the bottom.
fig = px.scatter_mapbox(dfBoatTrack,
lat=dfBoatTrack.lat,
lon=dfBoatTrack.lon)
fig.update_layout(mapbox_style=“open-street-map”)
fig.update_layout(
mapbox_style=“white-bg”,
mapbox_layers=[
{
“sourcetype”: “raster”,
“sourceattribution”: “Government of Norway”,
“source”: [“https://gis.fiskeridir.no/server/services/fiskeridirWMS/MapServer/WMSServer?service=wms&request=getMap&bbox={bbox-epsg-3857}”
“&version=1.3.0&layers=all&CRS=EPSG:3857&format=image/png1”],
“below”: “traces”
}
])
fig.update_geos(fitbounds=“locations”)
fig.update_layout(height=800, width=800, margin={“r”:0,“t”:0,“l”:0,“b”:0})
fig.show()
Any ideas?

