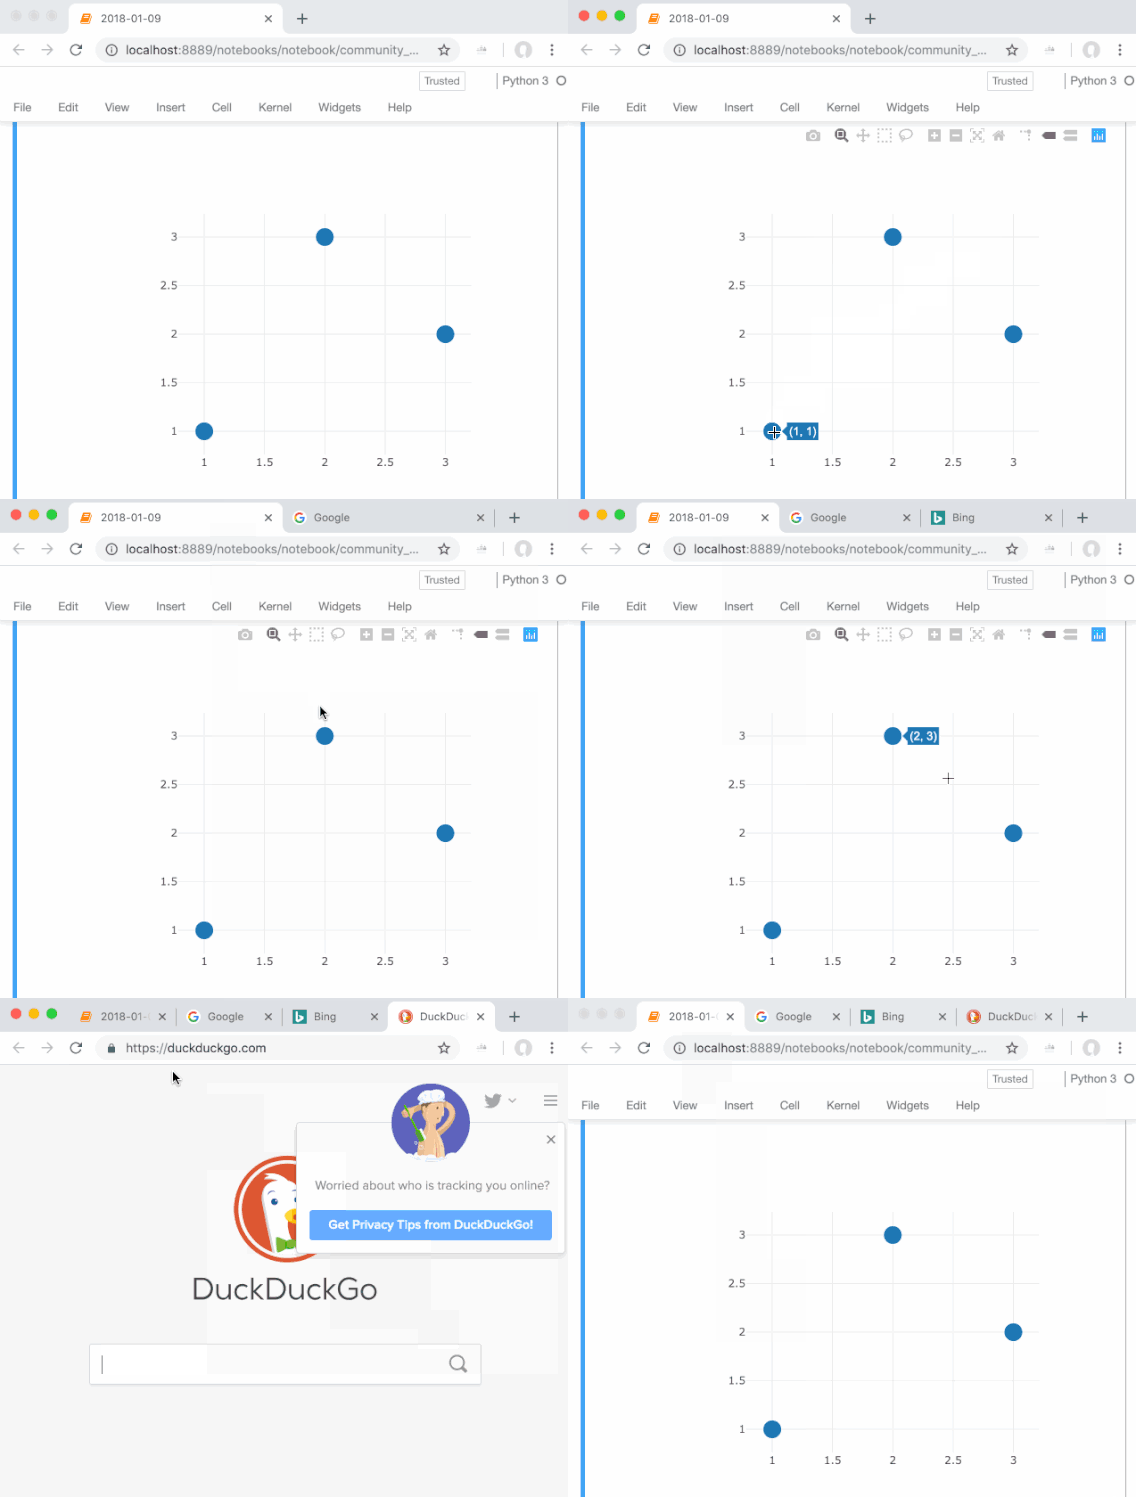
This is what I want to achieve.
Hi @lee, the app below updates the target of a link when hovering on plot data. Another solution would be to update the dcc.Location ie the URL bar of the current tab. I don’t think you can open a new browser tab (see Trigger a click on html.A() from callback) but I might be wrong. Here the trick is to use the customdata argument of plotly traces functions.
import dash
import dash_core_components as dcc
import dash_html_components as html
from dash.dependencies import Input, Output
from dash.exceptions import PreventUpdate
import plotly.graph_objects as go

app = dash.Dash(__name__)

urls = ['https://www.google.com', 'https://dash.plot.ly', 'https://plot.ly']

app.layout = html.Div([
        html.A(children='Please click this link', id='link',
            href='https://dash.plot.ly', target='_blank'),
        dcc.Graph(
            id='figure',
            figure=go.Figure(data=go.Scatter(x=[1, 2, 3],
                                             y=[2, 4, 6],
                                             customdata=urls),
                             layout=go.Layout(clickmode='event+select'))
            ),
        ]
        )


@app.callback(
    Output('link', 'href'),
    [Input('figure', 'hoverData')])
def display_hover_data(hoverData):
    if hoverData:
        target = hoverData['points'][0]['customdata']
        return target
    else:
        raise PreventUpdate


if __name__ == '__main__':
    app.run_server(debug=True)
Hi @Emmanuelle, thank you very much for your solution.
Although it may not be the perfect solution, but it solve my problem in a way.
Hi @Emmanuelle
I was wondering if you could reproduce this example for px.scatter as I am having some difficulty with this
Hi @msuths1,
I’m assuming the problem you encounter is how to specificy the customdata?
With graph_objects, you can use the customdata attribute to define additional data like the links in the above example (see here in the docs). Plotly express doesn’t have the exact same implementation, but you can get the same functionality in one of two ways:
- Turn your data into a dataframe.
px.scatterhas thecustom_dataattribute that takes for example a list of column names in your dataframe and turns it into customdata. In the above example:
# Additional imports compared with above example:
import pandas as pd
import plotly.express as px

app = dash.Dash(__name__)
df = pd.DataFrame(
    dict(
        x=[1, 2, 3],
        y=[2, 4, 6],
        urls=[
            "https://www.google.com",
            "https://www.plotly.com",
            "https://plotly.com/dash/",
        ],
    )
)
app.layout = html.Div(
    [
        html.A(
            children="Please click this link",
            id="link",
            href="https://dash.plot.ly",
            target="_blank",
        ),
        dcc.Graph(
            id="figure",
            # specify custom_data to be the "urls" column
            figure=px.scatter(data_frame=df, x="x", y="y", custom_data=("urls",)),
        ),
    ]
)
-
px.scattercreates a figure object. You create the figure object ahead of defining the layout (or even pack it in a function if you want) and then just add thecustomdataafter creating the figure like so:
urls = ["https://www.google.com", "https://www.plotly.com", "https://plotly.com/dash/"]

fig = px.scatter(x=[1, 2, 3], y=[2, 4, 6], custom_data=urls)
fig.update_traces(customdata=urls)

app = dash.Dash(__name__)
#
app.layout = html.Div(
    [
        html.A(
            children="Please click this link",
            id="link",
            href="https://dash.plot.ly",
            target="_blank",
        ),
        dcc.Graph(id="figure", figure=fig),
    ]
)
The rest of the app doesn’t have to change, that is, the callbacks remain the same. Hope that helps.
