How to visualize 3 columns with boolean values?

I am desperately looking for solution to this problem and do not know how to tackle it:

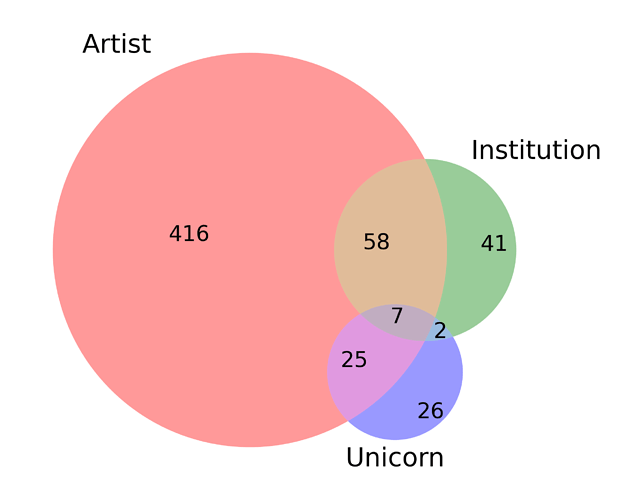
I have boolean data (True/False) on 3 categories. People were asked to tick one or multiple of the categories. I want to visualize the overall and overlapping counts.

Sample data:

| artist | institution | unicorn |
|--------|-------------|---------|
| True   | False       | False   |
| False  | True        | False   |
| False  | False       | True    |
| True   | True        | False   |
| False  | True        | True    |
| True   | False       | True    |
| True   | True        | True    |

How would you visualize that in python?

Sorry if this is the wrong section, I am new to plotly and data viz. Somewhat used to python programming, but not a pro. I’d like to learn more and find a community to talk to, if you can point me to a direction I would be very happy!

Hi @pitscher,

Welcome to Plotly forum!!!

You can visualize your boolean groups, either:

  1. in subplots of 1 row and 3 columns; each subplot contains two bars of height equal respectively with the counts of True and False values for a group:
import plotly.graph_objects as go
import pandas as pd
from plotly.subplots import make_subplots

d = {'artist': [ 1, 0, 1, 1, 1, 0,1, 1,0,1],
     'institution': [0, 1, 0, 1,1,0,1, 1, 0, 1],
     'unicorn': [1,0,1,0,0,1,0,0,0,1]}
df = pd.DataFrame(d)

fig = make_subplots(rows=1, cols=3, subplot_titles=('Artist', 'Institution', 'Unicorn'))
L= len(df)

cnames = list(df.columns)
for k, name in enumerate(cnames):
    n_true = df[name].sum()
    fig.add_trace(go.Bar(x=['True', 'False'], y=[n_true, L-n_true], name=name ), 1,k+1)
fig.update_layout(barmode='relative',  bargap=0.05, width=700, height=400)

or
2. in a figure consisting in three stacked bars:

fig1 = go.Figure(data=[go.Bar(x=['Artist',  'Institution', 'Unicorn'], 
                              y =[df['artist'].sum(),
                                  df['institution'].sum(), 
                                  df['unicorn'].sum() ], 
                                  name='True'),
                       go.Bar(x=['Artist',  'Institution', 'Unicorn'], 
                              y =[L-df['artist'].sum(),
                                  L-df['institution'].sum(), 
                                  L-df['unicorn'].sum()], 
                                  name='False')])
fig1.update_layout(barmode='stack',   bargap=0.07, width=600, height=400)

Fig2

2 Likes

Wow, thank you! I did not expect you to deliver the code :slight_smile:

But I think I was not very clear with my goal. Let’s stay with the dataframe {d} you created:

L= len(df)
print(f"All People: {L}")

A = df['artist'].sum()
print(f"All Artists: {A}")

I = df['institution'].sum()
print(f"All Institution: {I}")

U = df['unicorn'].sum()
print(f"All Unicorn: {U}")

AI = df.loc[(df['artist'] == 1) & (df['institution'] == 1) & (df['unicorn'] == 0)]
print(f"Artist & Institution: {len(AI)}")

AU = df.loc[(df['artist'] == 1) & (df['institution'] == 0) & (df['unicorn'] == 1)]
print(f"Artist & Unicorn: {len(AU)}")

IU = df.loc[(df['artist'] == 0) & (df['institution'] == 1) & (df['unicorn'] == 1)]
print(f"Institution & Unicorn: {len(IU)}")

AIU = df.loc[(df['artist'] == 1) & (df['institution'] == 1) & (df['unicorn'] == 1)]
print(f"Artist & Institution & Unicorn: {len(AIU)}")

output:

All People: 10
All Artists: 7
All Institution: 6
All Unicorn: 4
Artist & Institution: 4
Artist & Unicorn: 2
Institution & Unicorn: 0
Artist & Institution & Unicorn: 1

How to best visualize all of those numbers so that their relation is clear? One Bar with 3 colors and inbetween shades? (but what about AIU then?) … Sorry I am somehow lost at this one, but have the feeling the solution should be super obvious.

@pitscher

To illustrate the boolean value of each position in a dataframe column I suggest the following idea:

Define a dataframe, df, and associate a Heatmap to z=df.values.T, i.e the rows in heatmap are the dataframe columns. Above this heatmap we are plotting a heatmap with the corresponding z of one row and len(df) columns, that contains the Boolean values resulted from a Boolean operation (and, or, not) between dataframe columns. The two heatmaps are represented in a subplot of two rows and 1 column:

import plotly.graph_objects as go
from  plotly.subplots import make_subplots
import pandas as pd
import numpy as np

def bool2string(A):
    #convert a binary array into an array of strings 'True' and 'False'
    S = np.empty(A.shape,  dtype=object)
    S[np.where(A)] = 'True'
    S[np.where(A==0)] = 'False'
    return S
clrs =[[0,  '#0000db'], #discrete colorscale to map 0 (False) to dark blue, and 1 (True) to red
       [0.5,  '#0000db'],
       [0.5, '#b10000'],
       [1, '#b10000']]
       
d = {'Artist': [ 1, 0, 1, 1, 1, 0,1, 1,0,1],
     'Institution': [0, 1, 0, 1,1,0,1, 1, 0, 1],
     'Unicorn': [1,0,1,0,0,1,0,0,0,1]}
df = pd.DataFrame(d)
fig = make_subplots(rows=2, cols=1, shared_xaxes=True)

fig.update_layout(yaxis_domain=[0.75, 1], yaxis2_domain=[0, 0.725]);# assign a smaller yaxis domain for the second heatmap
groups = list(df.columns)
A = df.values.T
fig.add_trace(go.Heatmap(z= A,  coloraxis='coloraxis', xgap=1, ygap=1, customdata = bool2string(A),
                           hovertemplate='%{customdata}<extra></extra>'), 2, 1)
# perform logical_and between A[0] and A[1] and convert the result to an array of ints;
# this array is then reshaped to a 2d array to be used as z in a Heatmap
and_01 = np.array(np.logical_and(A[0], A[1]), int).reshape(1,-1)


fig.add_trace(go.Heatmap(z= and_01,
                         coloraxis='coloraxis',
                          xgap=1, customdata = bool2string(and_01),
                          hovertemplate='%{customdata}<extra></extra>'
                           ), 1, 1)
fig.update_layout(title_text= 'Your title', title_x=0.5,
                  width=799, height=400, 
                  coloraxis=dict(colorscale=clrs, showscale=False),
                  yaxis2_tickvals=[0, 1,2], yaxis2_ticktext= groups, #yaxis2 is the yais of the heatap of 3 rows and 10 cols
                  yaxis2_autorange='reversed', 
                  yaxis_showticklabels=False, 
                  yaxis_title=f'{groups[0]}<br>and<br>{groups[1]}')

You can proceed similarly for A[0] and A[2], A[1] and A[2]
To calculate A[0] and A[1] and A[2] use chained np.logical_and:

and_012 = np.logical_and(np.logical_and(A[0], A[1]), A[2])
and_012  =  np.array(and_012, int).reshape(1,-1)

Hey @empet

Thanks again for your kind solution and looking through your code I learned some tricks.
In the end I figured I needed a Venn Diagram, which is a bit hard to make in plotly, but there is matplotlib library that makes it super easy.
This is the kind of information I wanted to show:

Proceeding with my dataset I have some similar problems to, but with more than 3 correlations (6-12).
I guess I will be going for some sort Sankey Diagram where Bar charts are not suitable.

Hi @pitscher

Why didn’t tell you before that you wanted Venn diagrams? You can draw them as Plotly shapes:
https://plot.ly/python/shapes/#venn-diagram-with-circle-shapes.

Because I didn’t know how to best visualize my data. I only came across Venn diagrams yesterday and they are very suitable in my case.

Sorry that I caused confusion. It seems I could not find the right words for my problem.