Button 1
Button 2
Button 3
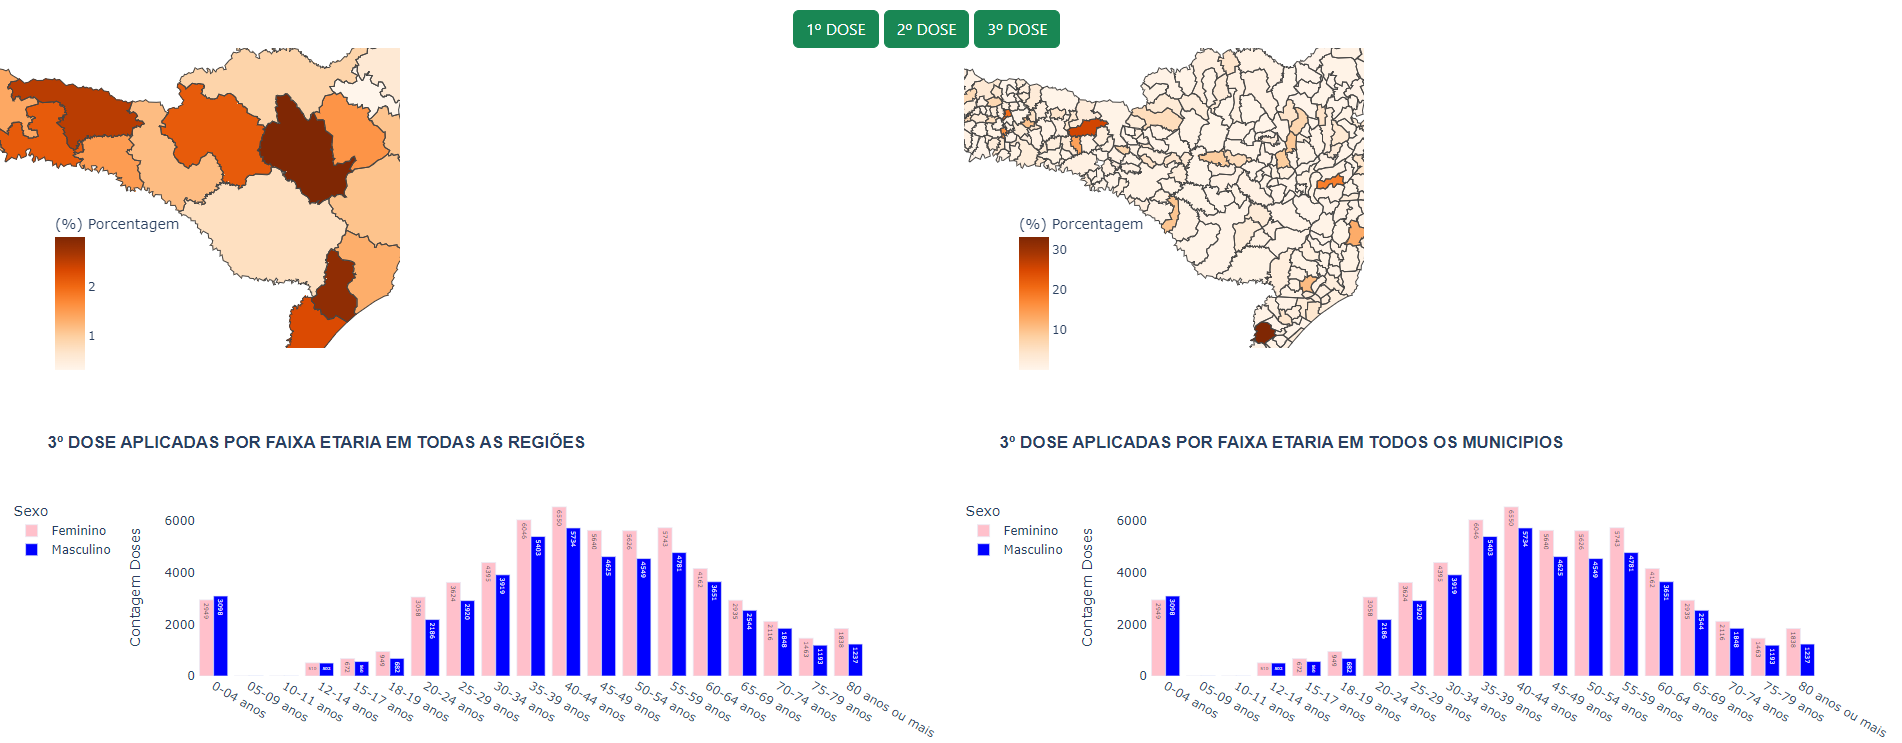
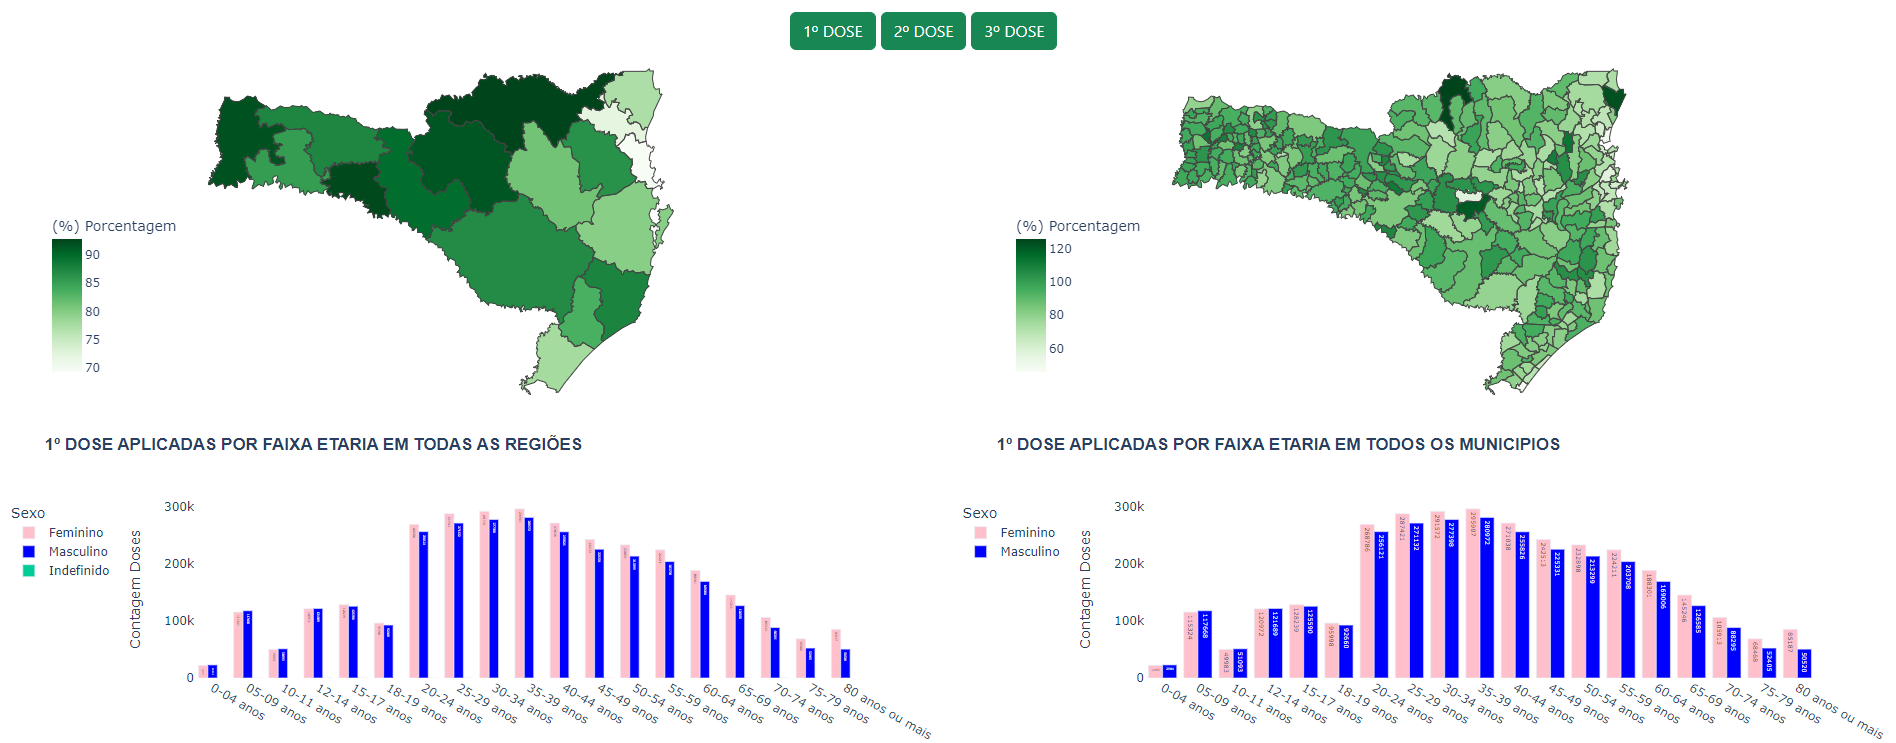
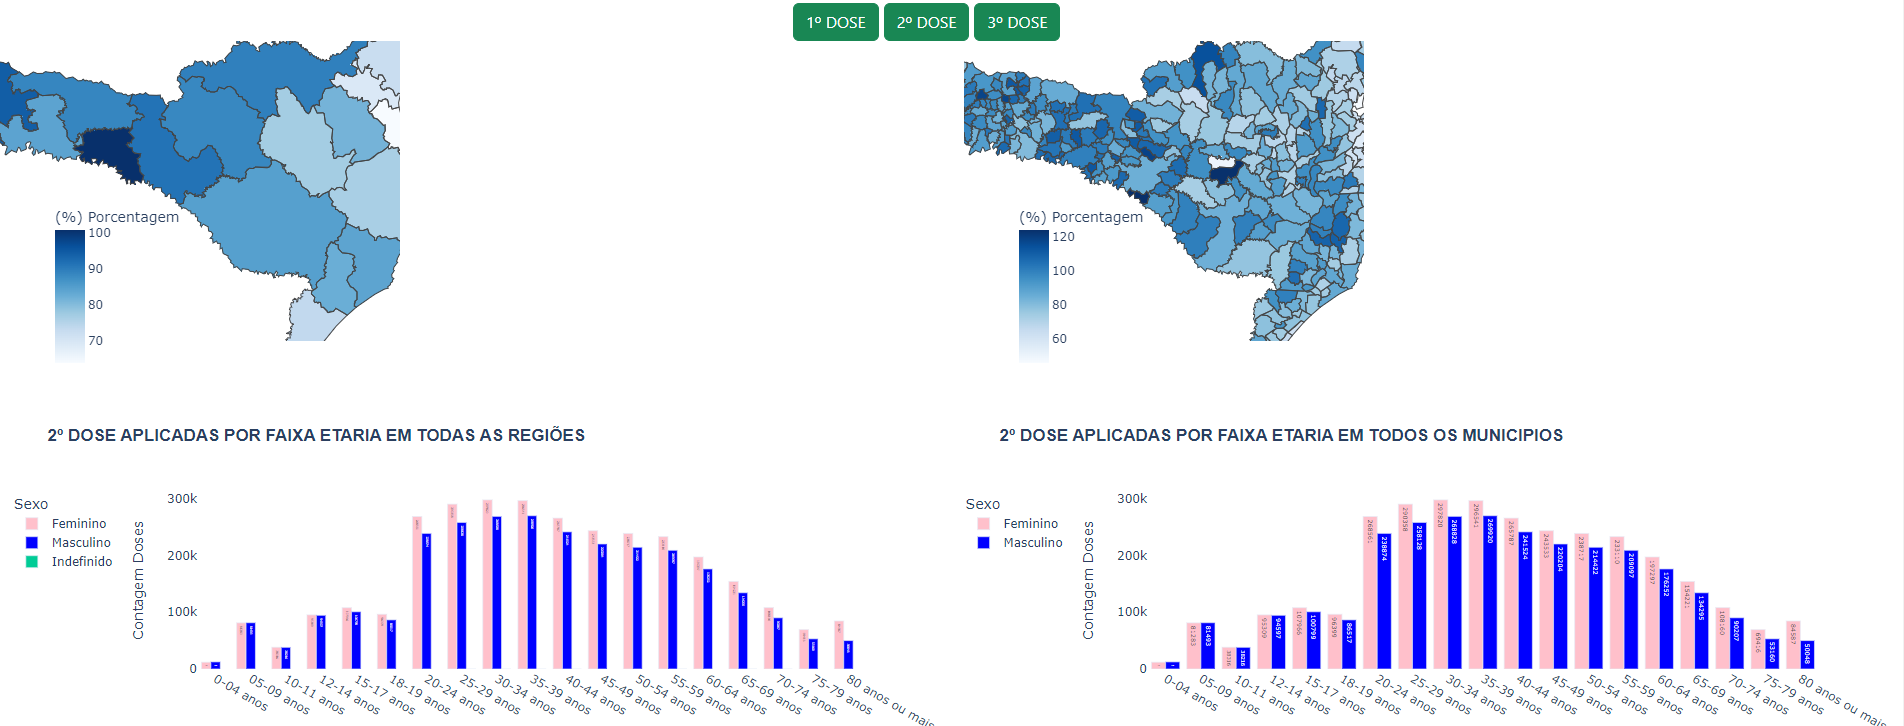
In the code below I want to simultaneously change the indicators based on the selected button, that is, each button will have 4 indicators to render. The choropleth maps of the 1st DOSE button are respecting the dimensioning, while the 2nd and 3rd buttons are not as shown in the attached image.
The question is how can I resolve this error?
Code buttons interacte:
@app.callback(
    [
        Output("bar-chart-terceira-dose-regiao", "style"),
        Output("map-choropleth-monovalente-terceira-dose-regiao", "style"),
        Output("bar-chart-terceira-dose-municipio", "style"),
        Output("map-choropleth-monovalente-municipio-terceira-dose", "style"),

        Output("bar-chart-segunda-dose-regiao", "style"),
        Output("map-choropleth-monovalente-segunda-dose-regiao", "style"),
        Output("bar-chart-segunda-dose-municipio", "style"),
        Output("map-choropleth-monovalente-municipio-segunda-dose", "style"),

        Output("bar-chart-primeira-dose-regiao", "style"),
        Output("map-choropleth-monovalente-primeira-dose-regiao", "style"),
        Output("bar-chart-primeira-dose-municipio", "style"),
        Output("map-choropleth-monovalente-municipio-primeira-dose", "style")
    ],
    [
        Input("btn-segunda-dose", "n_clicks"),
        Input("btn-primeira-dose", "n_clicks"),
        Input("btn-terceira-dose", "n_clicks")
    ]
)
def toggle_visualization(btn_segunda_dose, btn_terceira_dose, btn_primeira_dose):
    ctx = dash.callback_context

    if not ctx.triggered:
        button_id = "btn-primeira-dose"  # Set the default button to FIRST DOSE
    else:
        button_id = ctx.triggered[0]["prop_id"].split(".")[0]

    # Get the active and default styles for the "btn-primeira-dose" button
    active_style = {"display": "block", 'width': '100%', 'height': '100%'}
    default_style = {"display": "none",'width': '100%', 'height': '100%'}

    styles = [default_style] * 12  # 12 outputs corresponding to 3 doses * 4 styles

    # Update styles based on the clicked button
    if button_id == "btn-primeira-dose":
        styles[8] = styles[9] = styles[10] = styles[11] = active_style  # First dose region and municipality
    elif button_id == "btn-segunda-dose":
        styles[4] = styles[5] = styles[6] = styles[7] = active_style  # Second dose region and municipality
    elif button_id == "btn-terceira-dose":
        styles[0] = styles[1] = styles[2] = styles[3] = active_style  # Third dose region and municipality

    return styles
Example Code Choropleth:
# TERCEIRA DOSE
figure3 = px.choropleth_mapbox(
    gdf_geojson, # Use the GeoDataFrame
    geojson=geojson_for_plot,  # Use the GeoJSON for plotting
    locations='Região Saude',  # Column in gdf_geojson with the location identifiers
    featureidkey="properties.REGIAO_SAU",  # Corresponding key in the GeoJSON
    color='(%) Porcentagem',  # Column in gdf_geojson to define the color
    hover_data=['População', '(%) Porcentagem', 'Contagem Doses'],
    #title='COBERTURA DA 3ª DOSE APLICADA POR REGIÃO',
    mapbox_style="white-bg",
    zoom=5.9,
    center={"lat": -27.5954, "lon": -51.024735},
    opacity=1,
    color_continuous_scale="Oranges"
)
figure3.update_layout(
    width=900,
    height=350,
    coloraxis_showscale=True,  # Mantém a legenda de cor visível
    coloraxis_colorbar=dict(
        title="(%) Porcentagem",  # Título da legenda
        yanchor="bottom", # Define a ancoragem vertical da legenda
        len=0.5,
        y=0.05,  # Posição vertical da legenda
        xanchor="left",  # Define a ancoragem horizontal da legenda
        x=0.05  # Posição horizontal da legenda
    ),
    margin={"r":0,"t":0,"l":0,"b":0}  # Remove as margens ao redor do mapa
)
Layout:
    dbc.Row([
        dbc.Col([

        ], width=5),
        dbc.Col([
            dbc.Button("1º DOSE", id="btn-primeira-dose", color="success", outline=False, className="mr-2 text-center", n_clicks=0, style={'margin-right': '5px'}),
            dbc.Button("2º DOSE", id="btn-segunda-dose", color="success", outline=False, className="mr-2 text-center", n_clicks=0, style={'margin-right': '5px'}),
            dbc.Button("3º DOSE", id="btn-terceira-dose", color="success", outline=False, className="mr-2 text-center", n_clicks=0, style={'margin-right': '5px'}),
        ], width=4),
        dbc.Col([

        ], width=3)
    ], style={'height': 'calc(100% - 100px)', 'width':'100%'}, className='mt-2'),

    #map-choropleth-monovalente-municipio-primeira-dose
    dbc.Row([
    dbc.Col([
        dbc.Card([
            dcc.Graph(id='map-choropleth-monovalente-primeira-dose-regiao', className='dbc', config=config_graph, figure=figure1),
            dcc.Graph(id='map-choropleth-monovalente-segunda-dose-regiao', className='dbc', config=config_graph, figure=figure2),
            dcc.Graph(id='map-choropleth-monovalente-terceira-dose-regiao', className='dbc', config=config_graph, figure=figure3),
        ], style={'border': 0})
    ], xs=12, sm=6, lg=6, xl=6),  # Grid properties are applied to 'Col'

    dbc.Col([
        dbc.Card([
            dcc.Graph(id='map-choropleth-monovalente-municipio-primeira-dose', className='dbc', config=config_graph, figure=figure4),
            dcc.Graph(id='map-choropleth-monovalente-municipio-segunda-dose', className='dbc', config=config_graph, figure=figure5),
            dcc.Graph(id='map-choropleth-monovalente-municipio-terceira-dose', className='dbc', config=config_graph, figure=figure6),
        ], style={'border': 0})
    ], xs=12, sm=6, lg=6, xl=6)
    ]),


    dbc.Row([
        dbc.Col([
            dbc.Card([
                    dcc.Graph(id='bar-chart-primeira-dose-regiao', className='dbc', config=config_graph, style={'display': 'block', 'width':'100%'}),
                    dcc.Graph(id='bar-chart-segunda-dose-regiao', className='dbc', config=config_graph, style={'display': 'block', 'width':'100%'}),
                    dcc.Graph(id='bar-chart-terceira-dose-regiao', className='dbc', config=config_graph, style={'display': 'block', 'width':'100%'})

            ],style={'border':0})
        ], xs=6, sm=6, lg=6, xl=6),
        dbc.Col([
            dbc.Card([
                    dcc.Graph(id='bar-chart-primeira-dose-municipio', className='dbc', config=config_graph, style={'display': 'block', 'width':'100%'}),
                    dcc.Graph(id='bar-chart-segunda-dose-municipio', className='dbc', config=config_graph, style={'display': 'block', 'width':'100%'}),
                    dcc.Graph(id='bar-chart-terceira-dose-municipio', className='dbc', config=config_graph, style={'display': 'block', 'width':'100%'})

            ],style={'border':0})
        ], xs=6, sm=6, lg=6, xl=6)
    ], style={'width': '100%', 'height': '100%'}),
