How to style a dashboard?

I don’t know much about CSS and I need help aligning these 4 smaller graphs under this larger graph. This is the closest I’ve come to being aligned.

My code:

fig_pick = px.pie(map_pick, values='Total', names='Map', title='Mapas com mais Picks no Valorant Champions 2022')
fig_pick.update_layout(margin=dict(l=40, r=25, t=45, b=20), height=300,  width=340 , template='darkly')

fig_ban = px.pie(map_ban, values='Total', names='Map', title='Mapas com mais Bans no Valorant Champions 2022')
fig_ban.update_layout(margin=dict(l=40, r=55, t=45, b=20), height=300,  width=340 , template='darkly')

fig_atk = px.bar(map_side, x='Map', y='Atk Wins', color='Map', title='Taxa de Vitórias nos mapas no lado de ataque pelo Valorant Champions em %:', 
            labels={
    'Atk Wins': 'Vitórias no lado de Ataque em %',
    'Map': 'Mapa'        }, text='Atk Wins')

fig_atk.update_traces(textposition='inside',texttemplate='%{text:.3s}')
fig_atk.update_layout(margin=dict(l=40, r=55, t=45, b=20), height=300,  width=360 , template='darkly')

fig_def = px.bar(map_side, x='Map', y='Def Wins', color='Map', title='Taxa de Vitórias nos mapas no lado de defesa pelo Valorant Champions em %:', 
            labels={
    'Def Wins': 'Vitórias no lado de Defesa em %',
    'Map': 'Mapa'        }, text='Def Wins')

fig_def.update_traces(textposition='inside',texttemplate='%{text:.3s}')
fig_def.update_layout(margin=dict(l=40, r=55, t=45, b=20), height=300,  width=360 , template='darkly')


app.layout = html.Div(children=[

        dbc.Row([

                dbc.Col([

                        dbc.Card([
                                
                                 html.H5('Opcões'),
                                 dcc.Dropdown(opcoes, value = 'ACS' , id='check_opcao', style={'width': '100%'}),
                                 
                        ],style={'height': '94vh', 'margin': '20px', 'padding': '20px', 'width': '300px'})

                ], sm=2),

                dbc.Col([

                        dbc.Row([dcc.Graph( id='grafico_gc_players', style={ 'width': '1100px'})], style={ 'margin': '20px', 'margin-right': '70px'}),
                        dbc.Row([
                                dbc.Col([dcc.Graph(id='map_pick', figure=fig_pick)], sm=3),
                                dbc.Col([dcc.Graph(id='map_ban', figure=fig_ban)], sm=3),
                                dbc.Col([dcc.Graph(id='map_side_atk', figure=fig_atk )], sm=3),
                                dbc.Col([dcc.Graph(id='map_side_def', figure=fig_def )], sm=3)
                        ])

                ],sm=10)
        ])
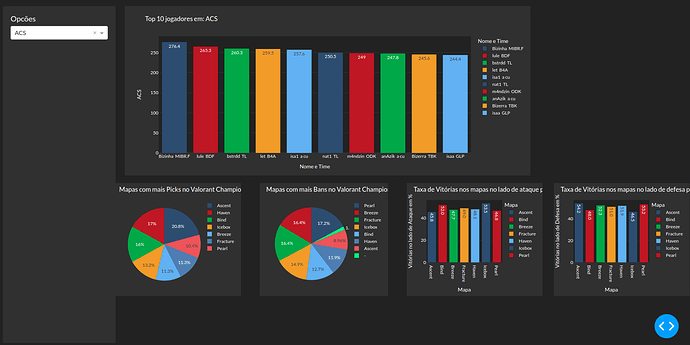
It looks like on this line you are giving this graph a hard width. If you remove that style, the dbc.Row should fill up all available space according to
https://dash-bootstrap-components.opensource.faculty.ai/docs/components/layout/

From a responsive design perspective, you generally don’t want to give a hard width value but utilize the sm md lg attributes to make your dashboard flow nicely

1 Like

I read the documentation and managed to fix the layout of the columns, but now I have added boards to the graphics and I need the graphics to be resized and fit inside the card, do you know where I can find a tutorial or related documentation for this? I am having problems

My new code:

fig_pick = px.pie(map_pick, values='Total', names='Map', title='Mapas com mais Picks no Valorant Champions 2022')
fig_pick.update_layout( height=300,  width=350 , template='darkly')

fig_ban = px.pie(map_ban, values='Total', names='Map', title='Mapas com mais Bans no Valorant Champions 2022')
fig_ban.update_layout(margin=dict(l=40, r=55, t=45, b=20), height=300,  width=340 , template='darkly')

fig_atk = px.bar(map_side, x='Map', y='Atk Wins', color='Map', title='Taxa de Vitórias nos mapas no lado de ataque pelo Valorant Champions em %:', 
            labels={
    'Atk Wins': 'Vitórias no lado de Ataque em %',
    'Map': 'Mapa'        }, text='Atk Wins')

fig_atk.update_traces(textposition='inside',texttemplate='%{text:.3s}')
fig_atk.update_layout(margin=dict(l=40, r=55, t=45, b=20), height=300,  width=340 , template='darkly')

fig_def = px.bar(map_side, x='Map', y='Def Wins', color='Map', title='Taxa de Vitórias nos mapas no lado de defesa pelo Valorant Champions em %:', 
            labels={
    'Def Wins': 'Vitórias no lado de Defesa em %',
    'Map': 'Mapa'        }, text='Def Wins')

fig_def.update_traces(textposition='inside',texttemplate='%{text:.3s}')
fig_def.update_layout(margin=dict(l=40, r=55, t=45, b=20), height=300,  width=340 , template='darkly')


app.layout = html.Div(children=[

        dbc.Row([


                        dbc.Col([

                                dbc.Card([
                                        
                                        html.H5('Opcões'),
                                        dcc.Dropdown(opcoes, value = 'ACS' , id='check_opcao', style={'width': '100%'}),
                                        
                                ],style={'height': '94vh', 'margin': '17px', 'padding': '17px', 'width': '300px'})

                        ], width= 'auto'),


                dbc.Col([

                        dbc.Row([

                                dbc.Col([dbc.Card(dcc.Graph( id='grafico_gc_players'), style={'padding': '10px'})] , width={"size": 8, 'offset':1})
                        ]),
                        
                        dbc.Row([
                                dbc.Col([dbc.Card(dcc.Graph(id='map_pick', figure=fig_pick), style={'padding': '10px'})], width=3),
                                dbc.Col([dbc.Card(dcc.Graph(id='map_ban', figure=fig_ban), style={'padding': '10px'})], width=3),
                                dbc.Col([dbc.Card(dcc.Graph(id='map_side_atk', figure=fig_atk ), style={'padding': '10px'})], width=3),
                                dbc.Col([dbc.Card(dcc.Graph(id='map_side_def', figure=fig_def ), style={'padding': '10px'})], width=3)
                        ])

                ],width=9)
        ])
        

So with dbc.Card, they come naturally with padding already built in (part of the fun of UI frameworks :smiley: . So your above code should not need the style={'padding': '10px'} call on them. If you remove this, the charts should fit within the card itself. Try that and see what it does
DBC Card Docs

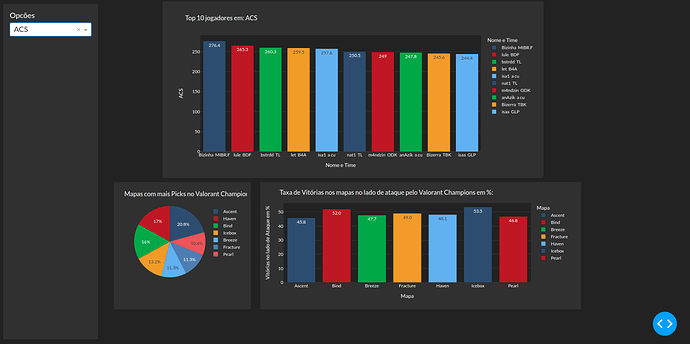
I modified a few things again in the code and got this result:

am i doing right? I don’t think I’m doing this responsively.

My code (v 3.0):

fig_pick = px.pie(map_pick, values='Total', names='Map', title='Mapas com mais Picks no Valorant Champions 2022', height=310)
fig_pick.update_layout(margin=dict(l=40, r=55, t=45, b=20) ,autosize=True , template='darkly')

fig_ban = px.pie(map_ban, values='Total', names='Map', title='Mapas com mais Bans no Valorant Champions 2022')
fig_ban.update_layout(margin=dict(l=40, r=55, t=45, b=20),  width=150, height=300 ,autosize=False , template='darkly')

fig_atk = px.bar(map_side, x='Map', y='Atk Wins', color='Map', title='Taxa de Vitórias nos mapas no lado de ataque pelo Valorant Champions em %:', 
            labels={
    'Atk Wins': 'Vitórias no lado de Ataque em %',
    'Map': 'Mapa'        }, text='Atk Wins', height=310, width=827)

fig_atk.update_traces(textposition='inside',texttemplate='%{text:.3s}' )
fig_atk.update_layout(margin=dict(l=40, r=55, t=45, b=20),autosize=True, template='darkly')

fig_def = px.bar(map_side, x='Map', y='Def Wins', color='Map', title='Taxa de Vitórias nos mapas no lado de defesa pelo Valorant Champions em %:', 
            labels={
    'Def Wins': 'Vitórias no lado de Defesa em %',
    'Map': 'Mapa'        }, text='Def Wins')

fig_def.update_traces(textposition='inside',texttemplate='%{text:.3s}')
fig_def.update_layout(margin=dict(l=40, r=55, t=45, b=20),  width=360, height=300 ,autosize=False , template='darkly')


app.layout = html.Div(children=[

        dbc.Row([


                        dbc.Col([

                                dbc.Card([
                                        
                                        html.H5('Opcões'),
                                        dcc.Dropdown(opcoes, value = 'ACS' , id='check_opcao', maxHeight=300, style={'color': 'MediumTurqoise', 'font-size': 20}),
                                        
                                ],style={'height': '94vh', 'margin': '17px', 'padding': '17px'})

                        ], width=2, sm=2, md=2),


                dbc.Col([

                        dbc.Row([

                                dbc.Col([dbc.Card(dcc.Graph( id='grafico_gc_players'), style={'padding': '10px'})] , width={"size": 8, 'offset':1}, sm=8, md=8)
                        ]),
                        
                        dbc.Row([
                                dbc.Col([dbc.Card(dcc.Graph(id='map_pick', figure=fig_pick), style={'height':'340px','padding': '10px'})], width=3, sm=3, md=3),
                                #dbc.Col([dbc.Card(dcc.Graph(id='map_ban', figure=fig_ban), style={'padding': '10px'})], width=2),
                                dbc.Col([dbc.Card(dcc.Graph(id='map_side_atk', figure=fig_atk ), style={'width': '856px','height':'340px', 'padding': '10px'})], width=9, sm=9, md=9),
                                #dbc.Col([dbc.Card(dcc.Graph(id='map_side_def', figure=fig_def ), style={'padding': '10px'})], width=4)
                        ])

                ],width=10, sm=10, md=10)
        ])