I’m creating a Candlestick chart on y0 and a Bar chart on y1, sharing the same X axis.
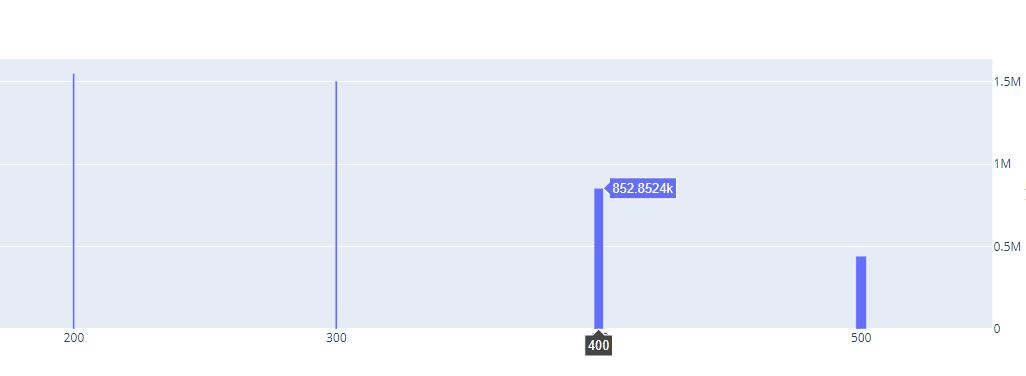
But the Bar chart not display well. How to adjust width of Bar chart?
Maybe it is because the auto adjustment of Bar chart due to the data.
Hey @pepito. I discovered datetime width is measured in milliseconds, which means, you’ll need a width of:
1000 * 3600 * 24 * 31
To have a one month width. If your time series is large, you’ll have to take into account gap years and the like and probably manually program each width. A bit cumbersome if you ask me