Infinitesimal width of Bar in Plotly graph objects

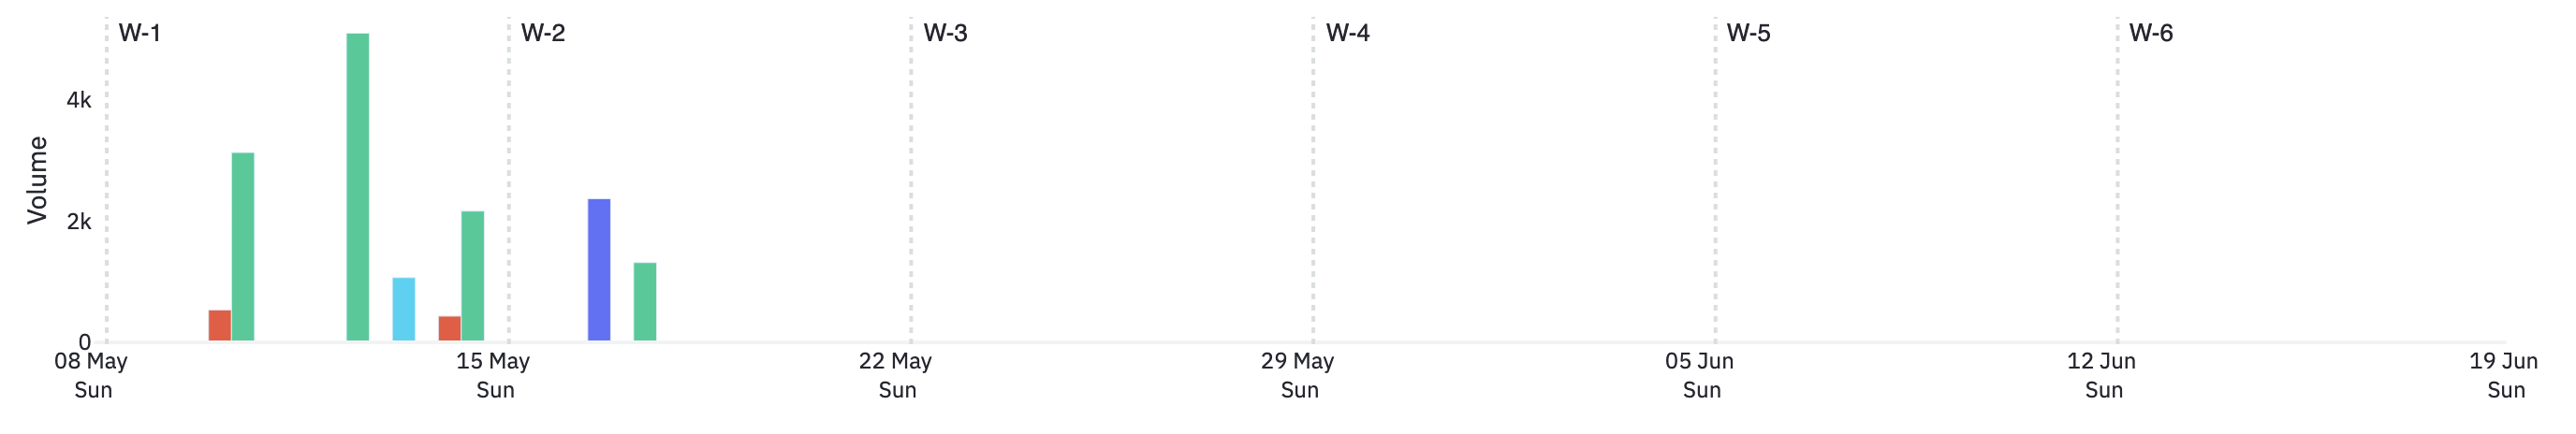
Hi, I am new to Plotly. I have tried to plot data in the form of bar charts with the data coming from a Pandas Dataframe. The X-axis represents a datetime column and the Y-axis represents a numeric column. When there is data for a lot of dates, the plot is as expected, but if there is data for just a single day, then the width of the bar becomes really thin such that it is not visible in the plot and is only visible when zoomed in to that particular day(and hour). I have attached images for reference of the whole plot and zoomed in plot. The code I am using for plotting is given below:

fig.add_trace(go.Bar(name=i, x=df_dict['All'][i]['date'], y=df_dict['All'][i]['Volume'], marker_color =color_map[i],visible = True))

And I also use update layout for setting the bar width:

fig.update_layout(barmode='group',bargap = 0.2, autosize=True,xaxis_range=[start_date, end_date])

Image of the complete plot:


Image of the zoomed in plot:

Image of plot with multiple date entries:

If anyone has any idea as to why this is happening and how I can fix this, please let me know. Thanks.

2 Likes

Hi there!
Did you find a solution to this problem?
Coincidentally, I am facing the EXACT SAME issue!
Why isnโ€™t anyone paying attention to this?
Can anyone help??!?!??!!

Hi @surojit_b Hi @tuco
:wave: Welcome to the community. And thank you for your question.

Can you please share a minimal reproducible example, so we can run your code locally on our computer and try to figure it out?

1 Like

Hi @adamschroeder,

Hereโ€™s the minimal reproducible example you can try out:

import pandas as pd
import datetime
import plotly.graph_objects as go

start_date = datetime.date(2022,4,28)
end_date = datetime.date(2022,6,10)
#READ FULL DATA
df = pd.read_csv('example.csv',parse_dates=['date'])
#MASKED DATAFRAME WITH JUST 1 DATAPOINT
df1 = df[df['date'].isin([df['date'].unique()[-1]])]
#MASKED DATAFRAME WITH 2 DATAPOINTS
df2 = df[df['date'].isin(df['date'].unique()[-3:-1])]

#PLOT THE DATAFRAME WITH 1 DATAPOINT
fig1 = go.Figure()
fig1.add_trace(go.Bar(x = df1['date'],y = df1['Volume']))
fig1.update_layout(barmode='group',bargap = 0.2, autosize=True,xaxis_range=[start_date, end_date])
fig1.show()
#PLOT THE DATAFRAME WITH 2 DATAPOINT
fig2 = go.Figure()
fig2.add_trace(go.Bar(x = df2['date'],y = df2['Volume']))
fig2.update_layout(barmode='group',bargap = 0.3, autosize=True,xaxis_range=[start_date, end_date])
fig2.show()
#PLOT ALL DATA
fig = go.Figure()
fig.add_trace(go.Bar(x = df['date'],y = df['Volume']))
fig.update_layout(barmode='group',bargap = 0.3, autosize=True,xaxis_range=[start_date, end_date])
fig.show()

You can find the .csv used above here: example.csv - Google Drive

The plots below are the ones you should get from the above code:

Plot with one data point (Barely visible)

Plot with one data point zoomed

Plot 2 data points

Plot with complete data

NOTE For the plot with 2 data points, the dates are 17th May and 26th May, but the width is so large that it covers 3-4 days. Is there some resolution for that??!

Let me know if you have any questions.

hi @tuco hi @surojit_b
Iโ€™ve looked into the docs and I canโ€™t find a way to display one bar in a bar plot aside from removing the xaxis_range.

Figure 1:

fig1 = go.Figure()
fig1.add_trace(go.Bar(x = df1['date'],y = df1['Volume']))
fig1.update_layout(barmode='group', bargap = 0.2, autosize=True)
fig1.show()

In regard to the second figure with two bar plots being plotted, one way to show them thinner, so they are above their respective days, is to increase the bargap from 0.3 to 0.9

Figure 2:

fig2 = go.Figure()
fig2.add_trace(go.Bar(x = df2['date'],y = df2['Volume']))
fig2.update_layout(barmode='group', bargap = 0.9, autosize=True, xaxis_range=[start_date, end_date])
fig2.show()

You can also set your own tickvalues to show those ticks where you know data is displayed.

fig2 = go.Figure()
fig2.add_trace(go.Bar(x = df2['date'],y = df2['Volume']))
fig2.update_layout(barmode='group',bargap = 0.3, autosize=True, xaxis_range=[start_date, end_date])
fig2.update_xaxes(
    ticktext=["May 10", "May 17", "May 26", "June 1"],
    tickvals=["2022-05-10", "2022-05-17", "2022-05-26", "2022-06-1"],
)
fig2.show()

Resulting in:

All of these issues come down to cases where itโ€™s tough for us to automatically decide on a bar width, or we donโ€™t pick the one you wanted. We have an issue open to improve the width we choose when thereโ€™s only one bar but if you know the bar width you want you can provide it yourself, as a number of milliseconds.
width = 1000 * 3600 * 24 โ†’ one day exactly
width = 1000 * 3600 * 24 * 0.8 โ†’ 80% of a day, same as bargap=0.2 if we were to detect a one-day spacing.

fig1 = go.Figure()
fig1.add_trace(go.Bar(x=['2000-01-03'],y=[1]))
fig1.update_traces(width=1000*3600*24*0.8)
fig1.update_layout(xaxis_range=['2000-01-01','2000-01-08'])
fig1.show()

1 Like