Hi
I have a table that’s shown in the terminal, but dont know how to show it in the dash dashboard.
It has a dropdown multi and a dropdown selection of numbers … depending on what’s selected on the number, the dropdown has n rows, and the other dropdown gives the final number of columns.
Please help, how can I show this table in the dash dashboard?
Edit: How do I do a callback and a definition that returns the table I can see in the terminal?
this is what I have:


but nothing is shown in the dashboard … what can I do to fix this?
this error appears with this loc … how can I make this error dissapear?
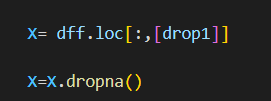

those vpip and wwsf where chosen with the dropdown
and I’ve changed this:

please, how can I fix this?
hi Javier (@topotaman)
Can you please paste your code in the questions and not an image. It’s a lot easier for us to answer posts that have preformatted text style, like this:
my_table = dash_table.DataTable)
   id="cluster-table",
   ...
You don’t need to create the dataTable in the callback if you already have it in the layout. You just need to return the data and possibly the columns in the Outputs of the callback.
hi, the columns and rows deppend of the dropdown menus … but, not really shure to do what you are saying … can you please give me an example of how to pull the data and the columns with the callback? (I dont have data in the layout) … I have the data printed in the terminal … but dont know how to duplicate that data to the dashboard.
This is in the df
my_table = dash_table.DataTable(
        id="cluster-table",
        #name="cluster-table",
        columns=drop1,
        #rows=drop2,
        data=dff5.to_dict()

    )
this is in the container:
dbc.Col(dash_table.DataTable(id="cluster-table"), md=8),
and this is the callback
@app.callback(Output('cluster-table', 'children'),Input('dropdown_for_table', "value"),Input('cluster-count002', "value"))
hi @topotaman
I’m still not very clear on what you’re trying to achieve. I just sent you a direct message.
this is what I whant to achieve:
with a dropdown menu, and another selector, use that to make a list, or dataframe with values, (with those dropdowns and a df I already have). The rows depend directly from the first dropdown, and the columns from the second one. (Using Kmeans)
then, just print that df or whatever it is in a table
hi @topotaman
So something like this sample app:
from dash import Dash, dcc, html, Output, Input, dash_table
import dash_bootstrap_components as dbc
import plotly.express as px
import pandas as pd

# https://www.kaggle.com/datasets/tsarina/mexico-city-airbnb?select=listings1.csv
df = pd.read_csv("https://raw.githubusercontent.com/Coding-with-Adam/Dash-by-Plotly/master/Other/Monterrey/airbnb.csv")

app = Dash(__name__, external_stylesheets=[dbc.themes.BOOTSTRAP])


app.layout = dbc.Container([
    dbc.Row([
        dbc.Col([
            dcc.Markdown('#### Select columns'),
            columns_input := dcc.Dropdown(df.columns, multi=True, value=["host_name","number_of_reviews"])
        ], width=6),
        dbc.Col([
            dcc.Markdown('#### Select number of rows'),
            rows_input := dcc.Input(type='number', value=10, min=1, max=200)

        ], width=6)
    ]),

    dbc.Row([
        dbc.Col([
            table_placeholder := html.Div()
        ], width=12)
    ])
])


@app.callback(
    Output(table_placeholder, 'children'),
    Input(columns_input, 'value'),
    Input(rows_input, 'value')
)
def update_graph(cols, data_size):
    print(cols)
    print(data_size)
    dff = df.loc[0:data_size, cols]

    your_table= dash_table.DataTable(
        id='your-table',
        data=dff.to_dict('records')
    )

    return [your_table]


if __name__ == '__main__':
    app.run_server(debug=True)
Hi, I had some trouble with this … eded doing another thing … I printed the data in the dashboard;
Now, just need to print it in a table, how? (the data has dropdown2 columns and dropdown1 rows) (the rows are fixed to a determinated number == 7)
