Hi,
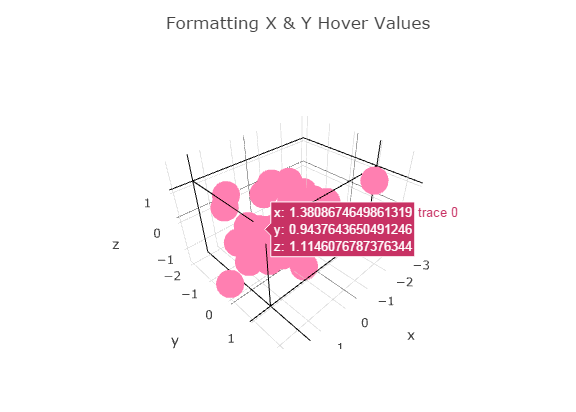
I am unable to customize hover information for scatter3d graphs, But it’s working for scatter graphs.
I used like below format.
hoverinfo=“x+y”;
Can you please help me to customize hover info.
Thnaks,
Hi,
I am unable to customize hover information for scatter3d graphs, But it’s working for scatter graphs.
I used like below format.
hoverinfo=“x+y”;
Can you please help me to customize hover info.
Thnaks,
Hmm.
hoverinfo should work for scatter3d traces.
Here’s an example with hoverinfo: 'x+y': https://plot.ly/~etpinard/7139/scatter3d-with-text/
Could you give us more information?
H @etienne ,
Thank you for quick reply.
But in your example it’s working.
Here i am sending the my example code, Can you please let me know, where i did mistake.
Thank you.

var N = 40,
x = d3.range(N).map( d3.random.normal() ),
y1 = d3.range(N).map( d3.random.normal() ),
z = d3.range(N).map( d3.random.normal() ),
data = [{ x:x,
      y:y1,
      z:z,
          type:'scatter3d', mode:'markers',
          marker:{color:'rgba(200, 50, 100, .7)', size:16},
          hoverinfo:"x+z"
         }
       ];
layout = {
    hovermode:'closest',
    title:'Formatting X & Y Hover Values',
    xaxis:{zeroline:false, hoverformat: '.2f', title: 'Rounded: 2 values after the decimal point on hover'},
    yaxis:{zeroline:false, hoverformat: '.2r', title: 'Rounded: 2 significant values on hover'}
 };

 Plotly.newPlot('myDiv', data, layout);
});
You must be using an old version of plotly.js.
Updating to the latest release: https://github.com/plotly/plotly.js/releases should solve your problems.
Thank you very much…
Now it’s working, after i updated to latest version of plotly.