Rendering unicode characters in a plot axis seems to work in python 2.7 at least. I have the following xaxis dictionary in figure layout for a histogram:
xaxis=dict(title=u"\u03A6"+"1 - " + u"\u03A6"+"2")
And it renders as expected:
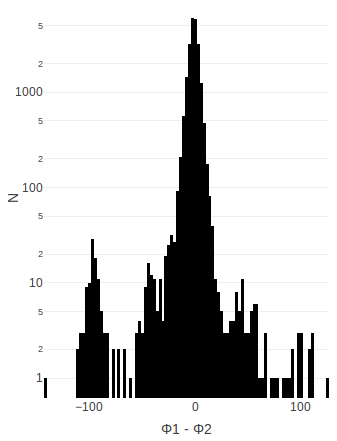
It’d be great to have the latex functionality working, but this is good enough for me for now, might be helpful to others.