I need to plot Italy’s map with points on it, using plotly and dash libraries. Actually, I’ve done that using go.scattergeo. But it does not show the borders of provinces. (Generally the quality of map is less than shape file that I have)
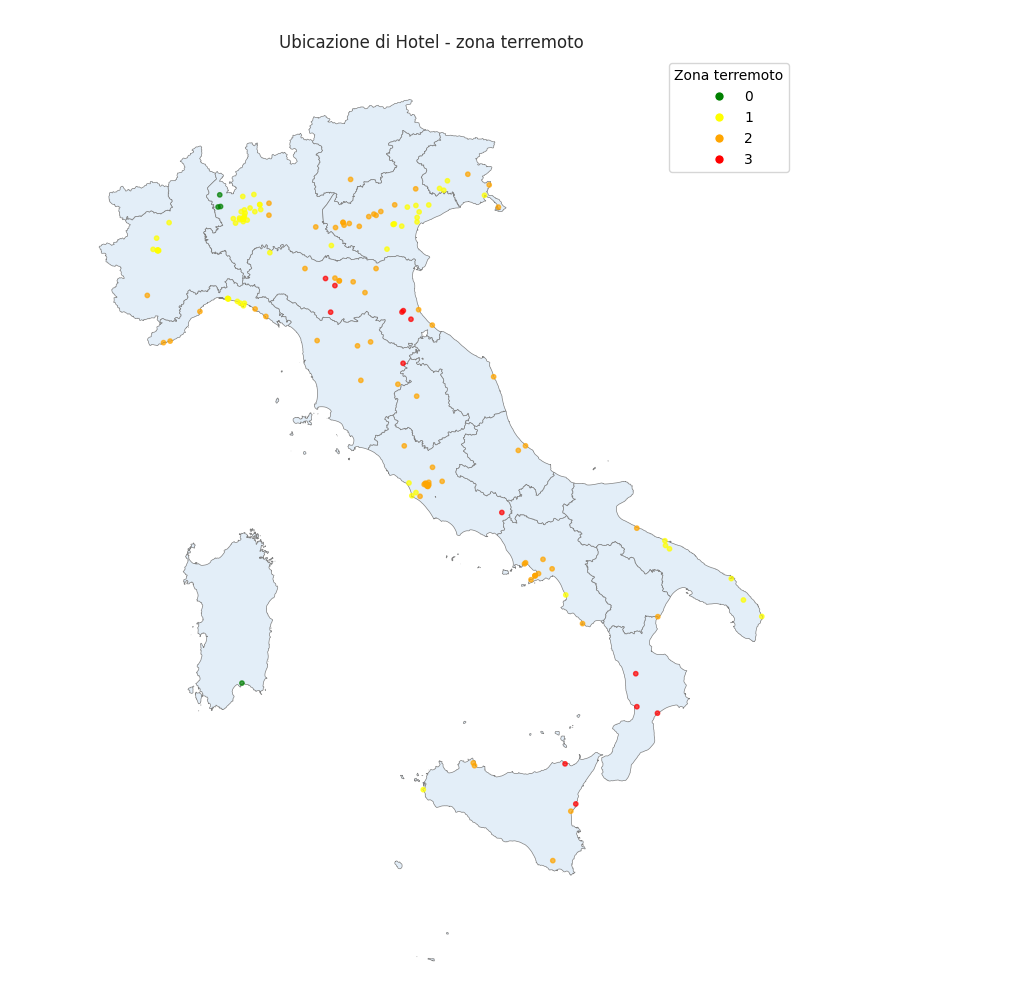
I also succeed to plot shape file with scatter points in matplotlib. But I have to plot it in plotly to use in my dashboard.
Is there any way to have a scatter plot with a shape file in plotly?
To have Ideas what’s the target I post the photos: This is my dash: