Hi everyone.
I would like to know if is it posible to use Python Plotly to plot geojson files I built using geoPandas. The files just have information like this:

each polygon is a triangle related to a meshing process.
I was able to plot with matplotlib just using df.plot()
Also I was able to plot also (and very fast) using QGIS. They looks like this:
My data is not related to a map. It is just geometric data (polygons and points)
I would like to know if can I built something similar without building a scatter from each polygon. I mean, something simpler like Scattergeo or similar.
Thank in advance!
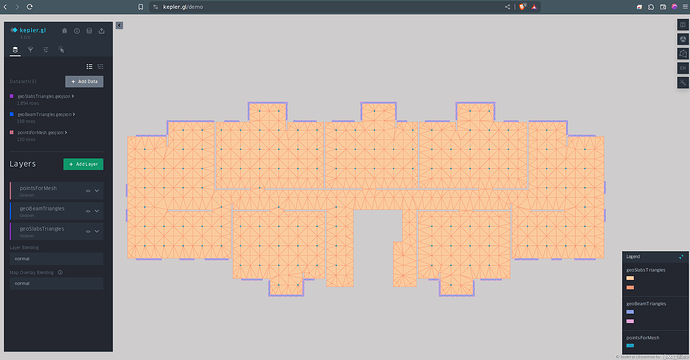
I can confirm that using kepler.gl it was also possible and very fast and smoth:
Finally I was able to implement it:
This is not slow and the code is not complex:
    fig1 = px.choropleth(slabs,
                        geojson=slabs.geometry,
                        locations= slabs.index,
                        basemap_visible=False,
                        color_continuous_scale="ylgnbu",
                        color = [1] * slabs.shape[0],
                        )


    fig2 = px.choropleth(beams,
                    geojson=beams.geometry,
                    locations= beams.index,
                        basemap_visible=False,
                        color_continuous_scale="ylgnbu",
                        color = [2] * beams.shape[0],
                        )

    fig3 = px.scatter_geo(points,
                        lon=points.geometry.x,
                        lat=points.geometry.y,
                        labels=points.tag,
                        hover_data= "tag",

                    )
    fig = go.Figure(data = fig1.data + fig2.data + fig3.data)

    fig.update_geos(fitbounds="locations")

    fig.update_layout(fig1.layout)

    fig.show()
1 Like


