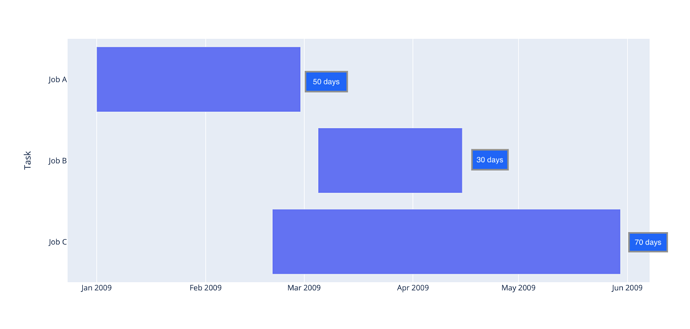
Hi I need a little help with a particular visualisation. The following is sample code taken from the official docs (Gantt Charts | Python | Plotly):
import plotly.express as px
import pandas as pd

df = pd.DataFrame([
    dict(Task="Job A", Start='2009-01-01', Finish='2009-02-28'),
    dict(Task="Job B", Start='2009-03-05', Finish='2009-04-15'),
    dict(Task="Job C", Start='2009-02-20', Finish='2009-05-30')
])

fig = px.timeline(df, x_start="Start", x_end="Finish", y="Task")
fig.update_yaxes(autorange="reversed") # otherwise tasks are listed from the bottom up
fig.show()
This code produces the following plot:
How should I modify the code so that the plot also shows the number of days within or on the right side of each bar. To give you a rough idea of what I mean please see below. With number of days I mean the number of days between ‘Start’ and ‘Finish’ which are available in a specific column in the data frame.
Any help is greatly appreciated!

