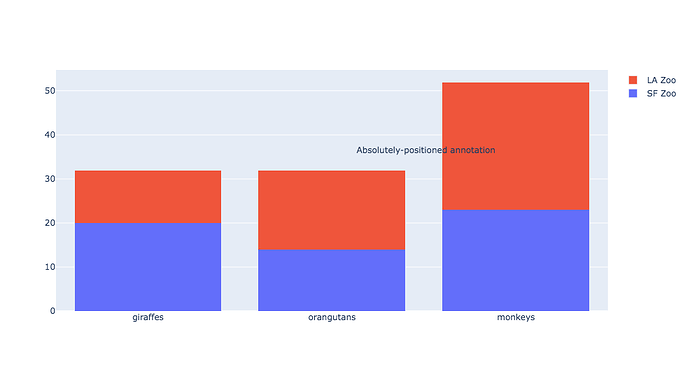
It is possible to place text anywhere in a categorical plot, e.g. a stacked bar graph? If so, how?
import plotly.graph_objects as go
animals=['giraffes', 'orangutans', 'monkeys']

fig = go.Figure(data=[
    go.Bar(name='SF Zoo', x=animals, y=[20, 14, 23]),
    go.Bar(name='LA Zoo', x=animals, y=[12, 18, 29])
])
# Change the bar mode
fig.update_layout(barmode='stack')
fig.show()
Hi @windrose, I see you are posting a quite a few new topics in the forum recently, maybe go through the documentation first. It is plenty of examples and the answer to most basic question will be documented there 
See here for the answer to your question:
Greetings, Alex
Hi @Alexboiboi, thanks a lot for your input.
I went back and forth through the documentation and adding text in a numerical plot is no problem, since you can simply specify the x and y coordinates - I got that. This is not the case, however, for categorical data on the x-axis; y-axis is no problem. For example, I found no solution how to place “Text 1” between the bar graphs as depicted above? You can place text in the bar graphs and anywhere on the y-axis with numerical values, but unfortunately it is nowhere mentioned how to do the same for the x-axis with categorical data?
ok maybe I wrote a bit too fast, sorry 
You still have the option to work with paper positioning like described here:
I didn’t check if it works with categorical plots though
1 Like
I don’t think that works with categorical data, but will check again.
You are right and I was wrong. The paper positioning does indeed also work with categorical plots. Sorry, I overlooked that. Thanks a lot.
import plotly.graph_objects as go
animals=['giraffes', 'orangutans', 'monkeys']

fig = go.Figure(data=[
    go.Bar(name='SF Zoo', x=animals, y=[20, 14, 23]),
    go.Bar(name='LA Zoo', x=animals, y=[12, 18, 29])
])


fig.add_annotation(text="Absolutely-positioned annotation",
                  xref="paper", yref="paper",
                  x=0.8, y=0.7, showarrow=False)

# Change the bar mode
fig.update_layout(barmode='stack')
fig.show
Unfortunately, it does not work with zoom, of course.
Perhaps free text/annotation positioning in categorical plots together with zoom could be implemented in a future update?
import plotly.graph_objects as go
animals=['giraffes', 'orangutans', 'monkeys']

fig = go.Figure(data=[
    go.Bar(name='SF Zoo', x=animals, y=[20, 14, 23]),
    go.Bar(name='LA Zoo', x=animals, y=[12, 18, 29])
])


fig.add_annotation(text="Absolutely-positioned annotation",
                  xref="paper", yref="paper",
                  x=0.8, y=0.7, showarrow=False)

config = dict({'scrollZoom':True
              })

# Change the bar mode
fig.update_layout(barmode='stack')
fig.show(config=config)
Feel free to open an Github issue regarding this topic.
One last option would be to use layout (zoom) change callback to adapt the paper coordinates but this will only work with a python kernel running, unless you implement the callback in javascript.
I just recently adopted Plotly for my the presentation of (most if not all of) my research results (we needed to make a windrose  to represent the frequency distribution of subjects in 360° angles). In combination with pandas it’s beautiful and much better than the commercial software that I have relied on previously, I think.
I do not have any python or javascript skills though. However, two of my students are fairly good at coding (as far as I can tell) and teach me a little here and there while I teach them other skills.


