Hi, I really need someone’s help!
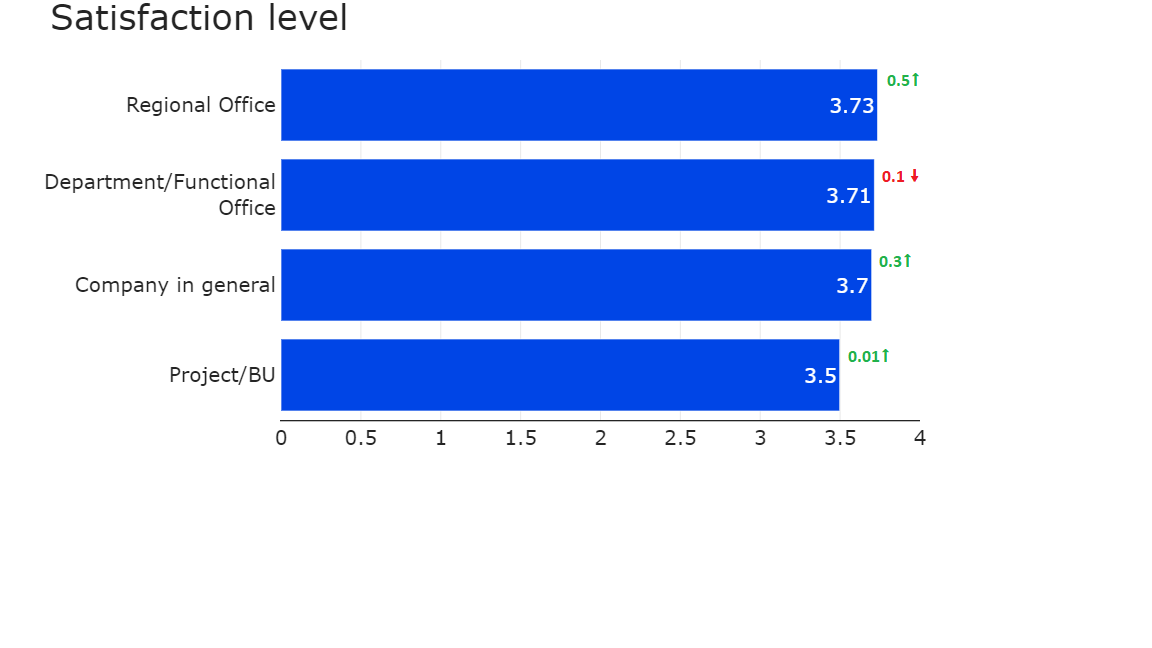
I am making simple bar plots or stacked subplots. How to position text like in the picture to each bar automatically without hardcoding it? Here is the example code:
def general_plot(df,title, h = 500, t_w = 21):
  df_mean =  df.mean().to_frame().reset_index().sort_values(0, ascending = True)
  f1 = px.bar(level, y = text_wrap(df_mean['index'], t_w), x = df_mean[0],  template="simple_white",
                      orientation = 'h',width = 1000, height = h, range_x = [0,4], text = round(df_mean[0],2))

  f1.update_xaxes(showgrid=True, automargin=True, ticks='',  title= '', linewidth = 1.3)
  f1.update_yaxes(
      ticks='',linecolor='rgba(0,0,0,0)', title= ''

  )
  f1.update_traces(hovertemplate=None, hoverinfo = 'skip',marker_color='#0045e6')
  #fs5.update_traces(hovertemplate=None, hoverinfo = 'skip',marker_color='rgba(102,0,51,1)',texttemplate='%{text:.2s}', textposition='outside')
  f1.update_layout( plot_bgcolor = 'rgba(0,0,0,0)', font =  { 'size' : 20}, title = title, titlefont = {'size':35})
  f1.show()
And the picture: