This app explores various attributes of shelter dogs. Here is a Plotly Studio link to it:
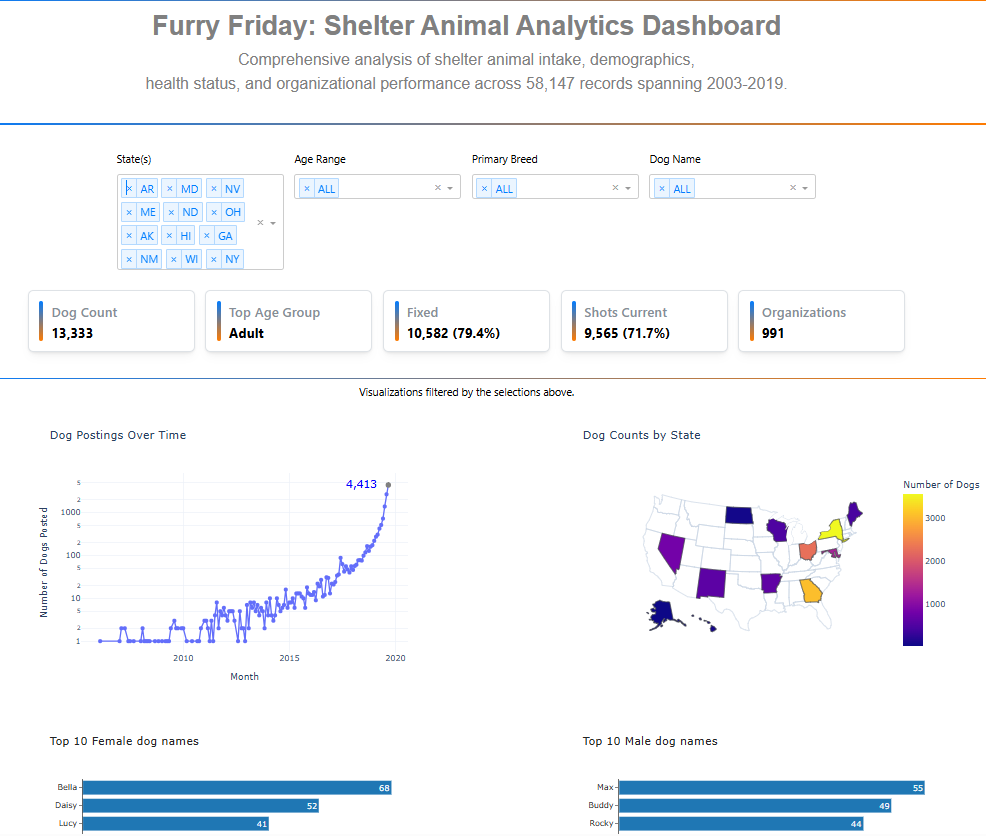
Filters along the top reduce the data reported in 5 Mantine cards and in the visualizations below them. The filters select one or more US states, age ranges, primary breed and dog names.
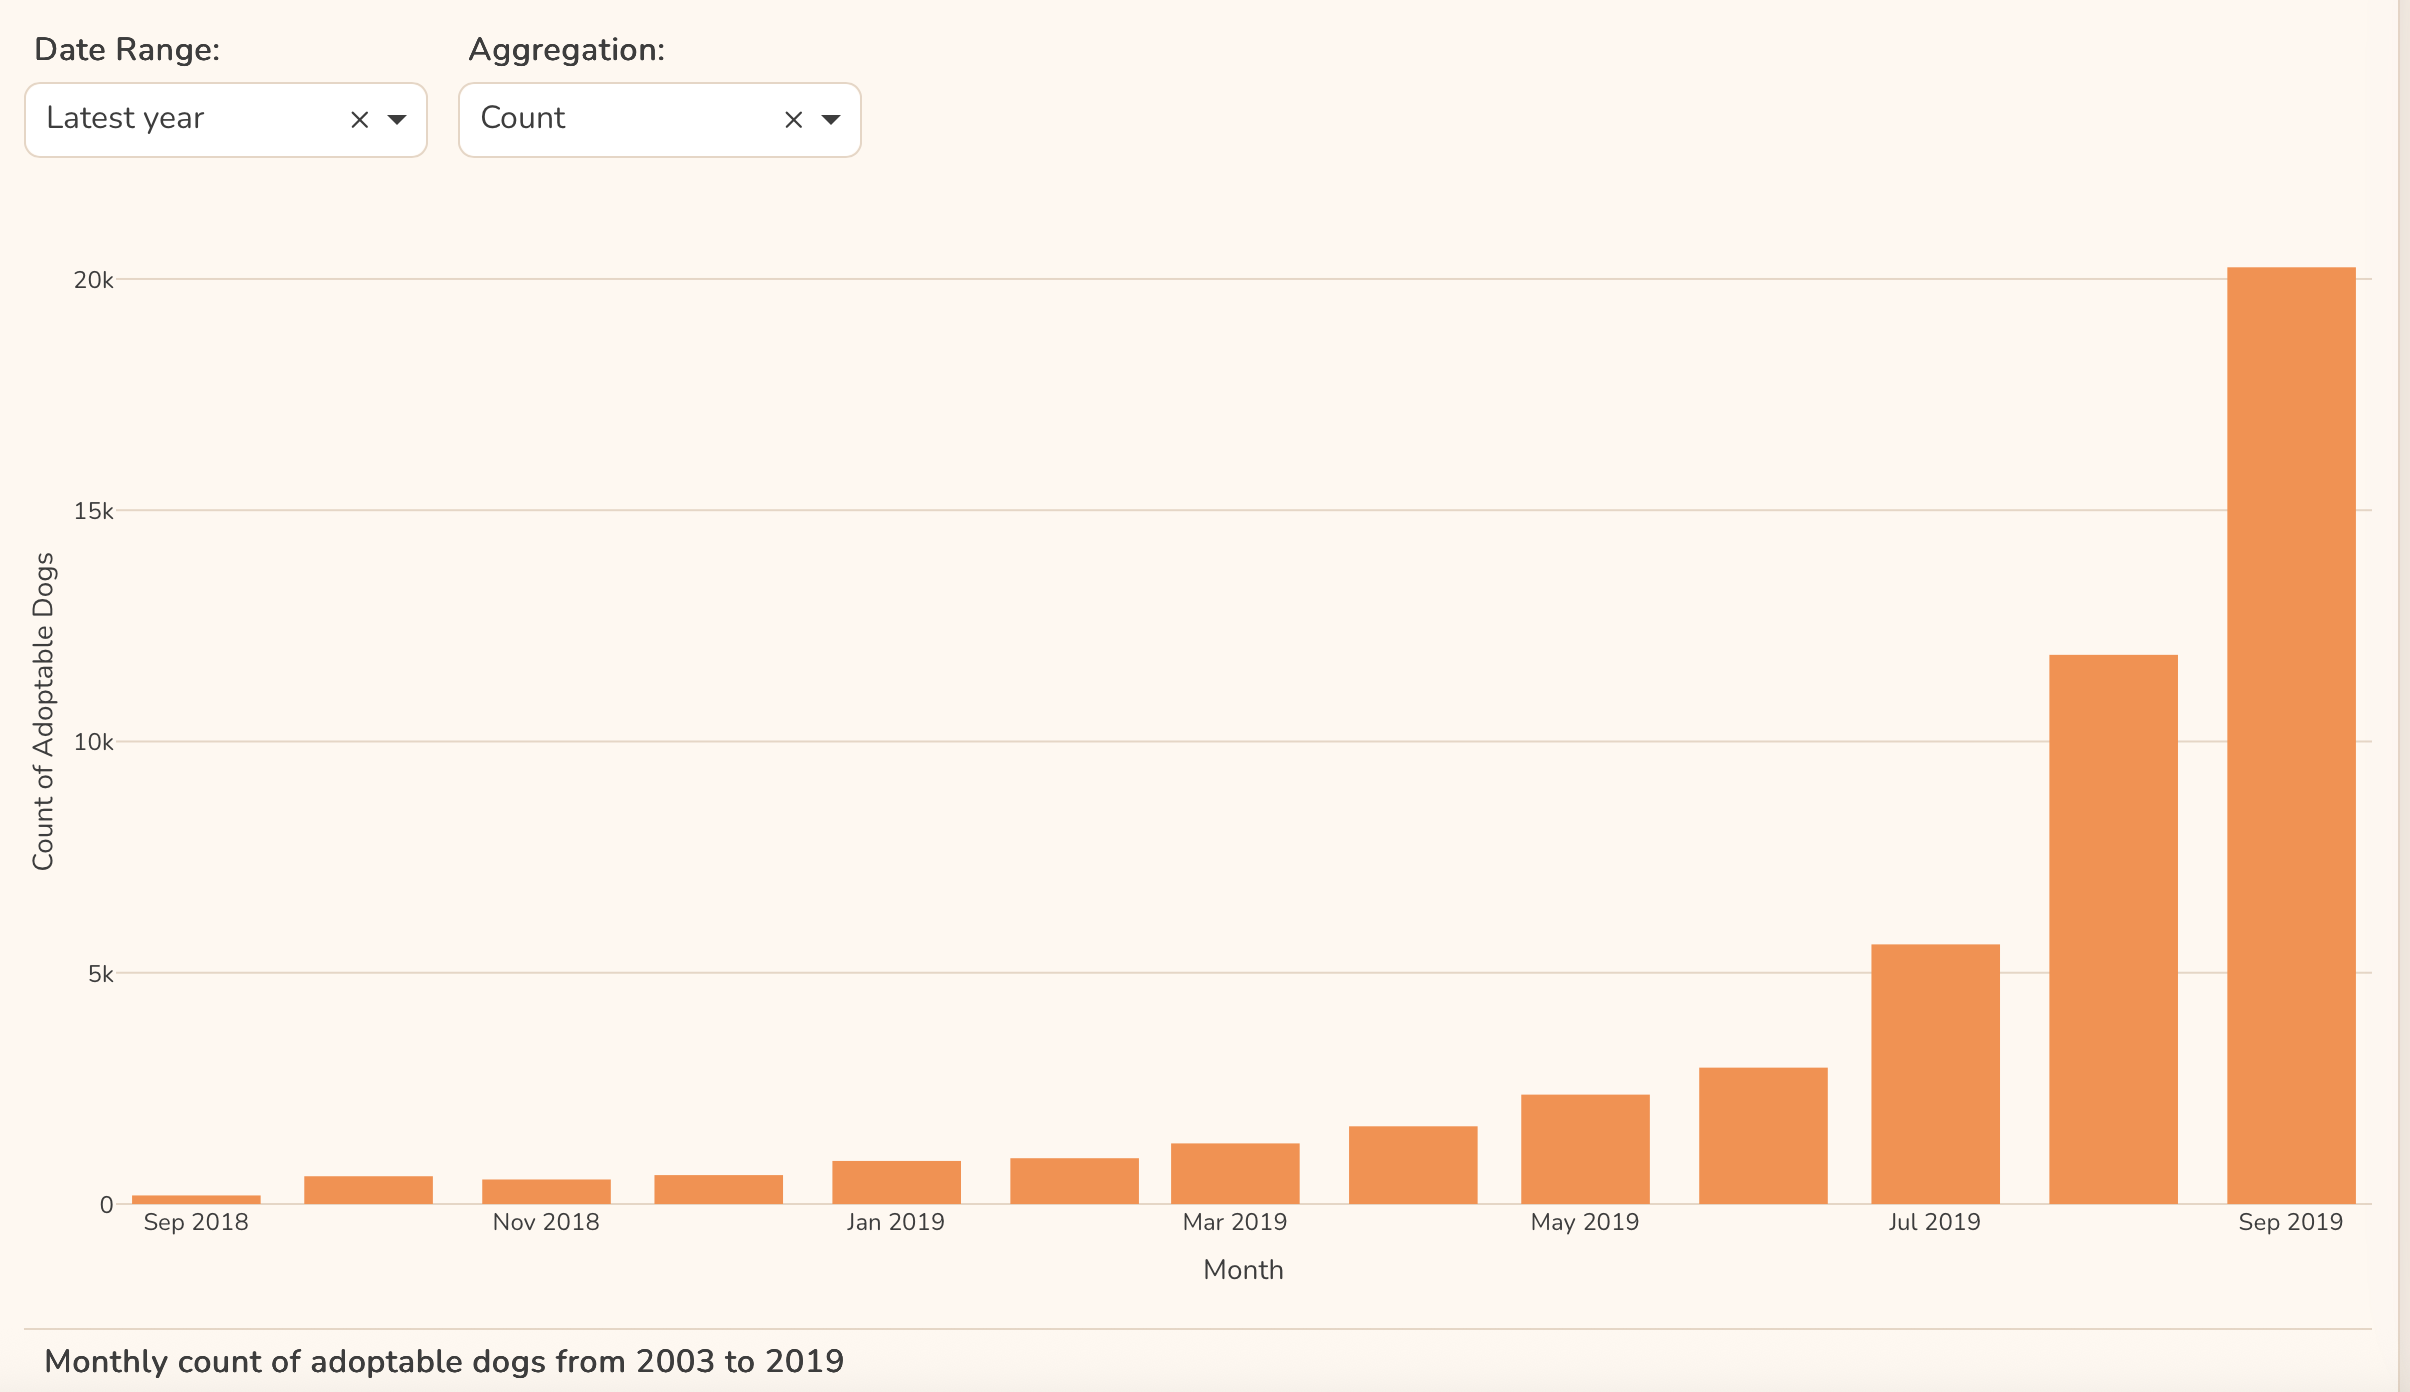
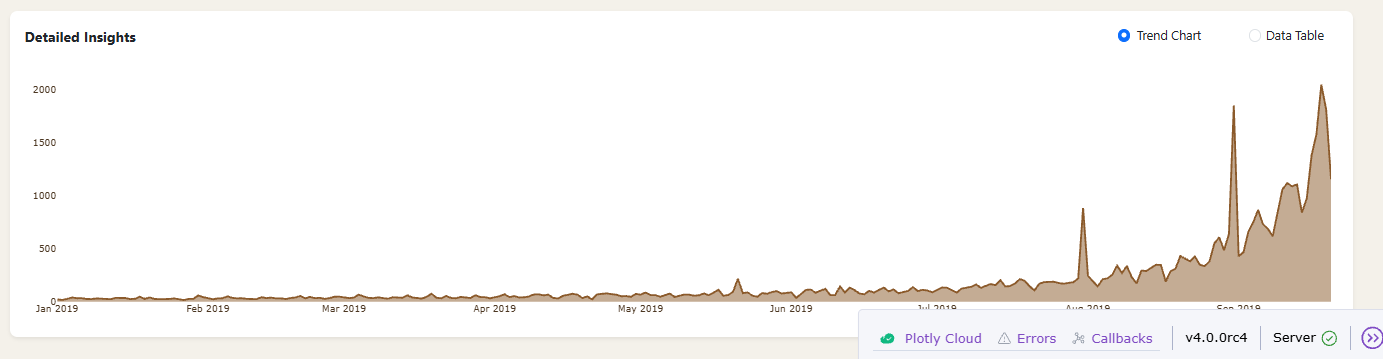
polars dynamic_group_by aggregates the data into 1 month intervals before plotting. A log scale on the y-axis improves dynamic range and readability. I added an annotation to the last point on the right, using a single point graph objects scatter plot with its y- value annotated to that point. Having this number visible helps when y is logarithmic.
The choropleth shows the number of dogs by state after filterering.
The 2 Pareto charts show the most popular female and male dog names after filtering.
The Dash AG table at the bottom is not pre-filtered, however it has floating filters for users to find the data they want.
I enjoyed growing my Mantine card skills and like this subject matter because dogs make me happy.
Have a wonderful Christmas, keep an eye out for Santa Paws!
I used Plotly Studio for inspiration and ideas but wrote most of the source code myself with minor help from LLMs. Here is the code:
import polars as pl
import os
import plotly.express as px
import plotly.graph_objects as go
from dash import Dash, dcc, html, Input, Output
import dash_mantine_components as dmc
import dash_ag_grid as dag

#----- GLOBALS -----------------------------------------------------------------
root_file = 'allDogDescriptions'
style_horizontal_thick_line = {'border': 'none', 'height': '4px',
    'background': 'linear-gradient(to right, #007bff, #ff7b00)',
    'margin': '10px,', 'fontsize': 32}
style_horizontal_thin_line = {'border': 'none', 'height': '2px',
    'background': 'linear-gradient(to right, #007bff, #ff7b00)',
    'margin': '10px,', 'fontsize': 12}
style_h2 = {'text-align': 'center', 'font-size': '40px',
            'fontFamily': 'Arial','font-weight': 'bold', 'color': 'gray'}
style_h3 = {'text-align': 'center', 'font-size': '24px',
            'fontFamily': 'Arial','font-weight': 'normal', 'color': 'gray'}
style_card = {'text-align': 'center', 'font-size': '20px',
            'fontFamily': 'Arial','font-weight': 'normal'}

# Responsive grid span for stat cards
dmc_card_span = {"base": 12, "sm": 6, "md": 2}
dmc_card_span = {"base": 12, "sm": 6, "md": 2}
#-----  FUNCTIONS --------------------------------------------------------------
def stat_card(title, value, id_prefix=None):
    '''Accessible, responsive stat card.
    title: label shown at top-left
    value: initial value string (can be empty, will show N/A)
    id_prefix: sets the value text id as f'{id_prefix}-info' to match callbacks
    '''
    value_txt = (
        f'{value:,}' if isinstance(value, (int, float))
        else (value if value not in (None, '') else 'N/A')
    )
    value_id = f'{id_prefix}-info' if id_prefix else None

    header = dmc.Group(
        justify='space-between',
        align='flex-start',
        children=[
            dmc.Text(title, size='xl', fw=600, c='dimmed'),
        ]
    )

    # Right-side content stack (title + value)
    content_stack = dmc.Stack([
        header,
        dmc.Space(h=4),
        dmc.Text(
            value_txt,
            id=value_id,
            size='xl',
            fw=700,
            style={'lineHeight': '1.1'}
        ),
    ], gap=0)

    # Left vertical accent bar
    accent_bar = html.Div(style={
        'width': '6px',
        'borderRadius': '4px',
        'background': 'linear-gradient(to bottom, #007bff, #ff7b00)'
    })

    # Row layout with accent bar + content
    row = html.Div([
        accent_bar,
        html.Div(content_stack, style={'flex': '1 1 auto'})
    ], style={'display': 'flex', 'gap': '12px', 'alignItems': 'stretch'})

    return dmc.Card(
        withBorder=True,
        shadow='sm',
        radius='md',
        padding='md',
        **{'aria-label': f'{title} statistic'},
        children=row
    )

def normalize_selection(selected_value, all_values_list):
    ''' Normalize dropdown/multiselect to handle ALL and ensure list type
    Input Args:
        selected_value: from dropdown/multiselect (can be string, list, or None)
        all_values_list: list of all possible values
    Returns:
        A list of selected values with 'ALL' properly handled
    '''
    # Handle None or empty list
    if selected_value is None or selected_value == []:
        return all_values_list

    # Handle 'ALL' as a string or as the only member of a list
    if selected_value == 'ALL' or selected_value == ['ALL']:
        return all_values_list

    # Handle list with 'ALL' in it
    if isinstance(selected_value, list):
        if 'ALL' in selected_value:
            # If list has ALL and other items, remove ALL
            filtered = [s for s in selected_value if s != 'ALL']
            return filtered if filtered else all_values_list
        return selected_value

    # Handle single string value
    return [selected_value]

def get_timeline_plot(df_filtered):
    # Create a timeline plot of dog postings over time
    df_time = (
        df_filtered
        .sort('DATE')             # sort before dynamic_group_by is a must
        .group_by_dynamic(
            index_column='DATE',  # specify the datetime column
            every='1mo',          # interval size
            period='1mo',         # window size
            closed='left'         # interval includes the left endpoint
        )
        .agg(pl.col('ID').count().alias('Dog Count'))
    )
    fig = px.line(
        df_time,
        x='DATE',
        y='Dog Count',
        title='Dog Postings Over Time',
        labels={'DATE': 'Month', 'Dog Count': 'Number of Dogs Posted'},
        markers=True
    )
    fig.update_layout(template='plotly_white', yaxis_type='log')
    # Extract last timeline point as Python scalars (Polars -> Python)
    last_date = df_time.select(pl.col('DATE').last()).item()
    last_count = int(df_time.select(pl.col('Dog Count').last()).item())

    # Add a marker + label using Plotly Graph Objects
    fig.add_trace(
        go.Scatter(
            x=[last_date],
            y=[last_count],
            mode='markers+text',
            text=[f'{last_count:,}  '],
            textposition='middle left',
            textfont=dict(size=16, color='blue'),
            marker=dict(size=8, color='gray'),
            hoverinfo='skip',
            showlegend=False,
            name=''
        )
    )
    return fig

def get_top_age_group(df):
    if df.height:
        return(
            df.get_column('AGE')
            .value_counts()
            .sort('count', descending=True)
            .item(0, 'AGE')
        )
    else:
        return('N/A')

def get_dog_name_pareto(df, gender):
    df_gender = (
        df
        .filter(pl.col('SEX') == gender)
        .group_by('NAME')
        .agg(NAME_COUNT = pl.col('ID').len())
        .select('NAME', 'NAME_COUNT')
        .sort('NAME_COUNT', descending=True)
    )
    if len(df_gender) > 10:
        df_gender = df_gender.head(10)

    fig = px.bar(
        df_gender, # .sort('NAME_COUNT'),
        y='NAME',
        x='NAME_COUNT',
        orientation='h',
        template='simple_white',
        title=f'Top 10 {gender} dog names',
        text=df_gender['NAME_COUNT'],
        labels={
        'NAME': '',
        }
    )
    fig.update_yaxes(autorange="reversed")
    fig.update_xaxes(
        showticklabels=False,
        ticks='',
        showline=False,
        title_text=''
    )
    return fig

def get_choropleth(df_filtered):
    # Create a choropleth map of dog counts by state
    df_state = (
        df_filtered
        .group_by('CONTACT_STATE')
        .agg(pl.col('ID').count().alias('Dog Count'))
    )
    fig = px.choropleth(
        df_state,
        locations='CONTACT_STATE',
        locationmode='USA-states',
        color='Dog Count',
        scope='usa',
        title='Dog Counts by State',
        labels={'CONTACT_STATE': 'State', 'Dog Count': 'Number of Dogs'}
    )
    fig.update_layout(template='plotly_white')
    return fig

#----- LOAD AND CLEAN DATA -----------------------------------------------------
root_file = 'allDogDescriptions'
if os.path.exists(root_file + '.parquet'):
    df = pl.read_parquet(root_file + '.parquet')
else:
    # Define Enum categories
    enum_AGE = pl.Enum(['Adult', 'Baby', 'Senior', 'Young'])
    enum_SEX = pl.Enum(['Male', 'Female', 'Unknown'])
    enum_SIZE = pl.Enum(['Small', 'Medium', 'Large','Extra Large'])
    df = (
        pl.read_csv(root_file + '.csv', ignore_errors=True)
        # Only all dog names with letters a-z or whitespace
        .filter(pl.col('name').str.contains(r'^[a-zA-Z\s]+$'))
        .select(
            NAME = pl.col('name').str.strip_chars().str.to_titlecase(),
            CONTACT_CITY = pl.col('contact_city'),
            CONTACT_STATE = pl.col('contact_state'),
            CONTACT_ZIP = pl.col('contact_zip').cast(pl.UInt32),
            BREED_PRIMARY = pl.col('breed_primary'),
            BREED_MIXED = pl.col('breed_mixed'),
            AGE = pl.col('age').cast(enum_AGE),
            SEX = pl.col('sex').cast(enum_SEX),
            SIZE = pl.col('size').cast(enum_SIZE),
            FIXED = pl.col('fixed'),
            HOUSE_TRAINED = pl.col('house_trained'),
            SHOTS_CURRENT = pl.col('shots_current'),
            DATE = pl.col('posted')   # regex for dates formatted as YYYY-MM-DD
                .str.extract(r'(\d{4}-\d{2}-\d{2})', group_index=1)
                .str.to_date('%Y-%m-%d'),
            TIME = pl.col('posted')   # regex for time formatted as HH:MM:SS
                .str.extract(r'(\d{2}:\d{2}:\d{2})', group_index=1)
                .str.to_time('%H:%M:%S'),
            ID = pl.col('id').cast(pl.UInt32),
            ORG_ID = pl.col('org_id'),
        )
        .filter(  # regex to accept states comprised of 2 uppercase letters
            pl.col('CONTACT_STATE').str.contains(r'^[A-Z]{2}$')
        )
    )
    df.write_parquet(root_file + '.parquet')

#----- GLOBAL LISTS ------------------------------------------------------------
contact_states = sorted(df.unique('CONTACT_STATE')['CONTACT_STATE'].to_list())
primary_breeds = sorted(df.unique('BREED_PRIMARY')['BREED_PRIMARY'].to_list())
animal_age_list = ['Baby', 'Young', 'Adult','Senior']
dog_name_list = sorted(df.unique('NAME')['NAME'].to_list())

#----- DASH COMPONENTS------ ---------------------------------------------------
dcc_select_contact_state = (
    dcc.Dropdown(
        placeholder='Select Contact State(s)',
        options=['ALL'] + contact_states, # menu choices
        value='ALL', # initial value
        clearable=True, searchable=True, multi=True, closeOnSelect=False,
        style={'fontSize': '18px'},
        id='id_select_contact_state'
    )
)
dcc_select_animal_age = (
    dcc.Dropdown(
        placeholder='Select Animal Age(s)',
        options=['ALL'] + animal_age_list, # menu choices
        value='ALL', # initial value
        clearable=True, searchable=True, multi=True, closeOnSelect=False,
        style={'fontSize': '18px'},
        id='id_select_animal_age'
    )
)
dcc_select_primary_breed = (
    dcc.Dropdown(
        placeholder='Select Primary Breed(s)',
        options=['ALL'] + primary_breeds, # menu choices
        value='ALL', # initial value
        clearable=True, searchable=True, multi=True, closeOnSelect=False,
        style={'fontSize': '18px'},
        id='id_select_primary_breed'
    )
)

# Dash Core Dropdown for dog name selection
dcc_select_dog_name = (
    dcc.Dropdown(
        placeholder='Select Dog Names',
        options=['ALL'] + dog_name_list, # menu choices
        value='ALL', # initial value
        clearable=True, searchable=True, multi=True, closeOnSelect=False,
        style={'fontSize': '18px'},
        id='id_select_dog_name'
    )
)

# Dash AG Grid Table for full df
def get_ag_grid_table(df):
    # Build columnDefs without floatingFilter
    column_defs = []
    for col in df.columns:
        col_def = {"headerName": col, "field": col, "floatingFilter": True}
        column_defs.append(col_def)
    return dag.AgGrid(
        id="ag-table-full-df",
        columnDefs=column_defs,
        rowData=df.to_dicts(),
        defaultColDef={"filter": True, "sortable": True, "resizable": True},
        style={"height": "500px", "width": "100%"}
    )
#----- DASH APPLICATION STRUCTURE ----------------------------------------------

app = Dash()
server = app.server
app.layout =  dmc.MantineProvider([
    html.Hr(style=style_horizontal_thick_line),
    dmc.Text('Furry Friday: Shelter Animal Analytics Dashboard', ta='center', style=style_h2),
    dmc.Text(
        'Comprehensive analysis of shelter animal intake, demographics,',
        ta='center', style=style_h3
    ),
    dmc.Text(
        'health status, and organizational performance across 58,147 records ' +
        'spanning 2003-2019.', ta='center', style=style_h3
    ),
    dmc.Space(h=30),
    html.Hr(style=style_horizontal_thick_line),
    dmc.Space(h=30),
    dmc.Grid(children =  [
        dmc.GridCol(dmc.Text('State(s)', ta='left'), span=2, offset=2),
        dmc.GridCol(dmc.Text('Age Range', ta='left'), span=2, offset=0),
        dmc.GridCol(dmc.Text('Primary Breed', ta='left'), span=2, offset=0),
        dmc.GridCol(dmc.Text('Dog Name', ta='left'), span=2, offset=0),
    ]),
    dmc.Space(h=10),
    dmc.Grid(
        children = [
            dmc.GridCol(dcc_select_contact_state, span=2, offset=2),
            dmc.GridCol(dcc_select_animal_age, span=2, offset=0),
            dmc.GridCol(dcc_select_primary_breed, span=2, offset=0),
            dmc.GridCol(html.Div([dcc_select_dog_name,]),span=2, offset=0)
        ],
    ),
    dmc.Space(h=30),
    dmc.Grid(children = [      # Summary cards row (responsive spans)
        dmc.GridCol(stat_card('Dog Count', '', id_prefix='dog-count'), span=dmc_card_span, offset=1),
        dmc.GridCol(stat_card('Top Age Group', '', id_prefix='top-age-group'), span=dmc_card_span),
        dmc.GridCol(stat_card('Fixed', '', id_prefix='fixed'), span=dmc_card_span),
        dmc.GridCol(stat_card('Shots Current', '', id_prefix='shots-current'), span=dmc_card_span),
        dmc.GridCol(stat_card('Organizations', '', id_prefix='organizations'), span=dmc_card_span),
    ]),
    dmc.Space(h=30),
    html.Hr(style=style_horizontal_thin_line),
        dmc.Grid(children =  [
        dmc.GridCol(dmc.Text('Visualizations filtered by the selections above.',
            ta='center'), span=10, offset=1),
    ]),
    dmc.Grid(children = [
        dmc.GridCol(dcc.Graph(id='timeline-plot'), span=5, offset=1),
        dmc.GridCol(dcc.Graph(id='choropleth-map'), span=5, offset=1),
    ]),
    dmc.Grid(children = [
        dmc.GridCol(dcc.Graph(id='pareto-female'), span=5, offset=1),
        dmc.GridCol(dcc.Graph(id='pareto-male'), span=5, offset=1),
    ]),
    html.Hr(style=style_horizontal_thin_line),
        dmc.Grid(children =  [
        dmc.GridCol(dmc.Text('Raw data table with floating filters',
            ta='center'), span=10, offset=1),
    ]),
    dmc.Grid(children = [
        dmc.GridCol(get_ag_grid_table(df), span=10, offset=1),
    ]),

])
@app.callback(
    Output('dog-count-info', 'children'),
    Output('top-age-group-info', 'children'),
    Output('fixed-info', 'children'),
    Output('shots-current-info', 'children'),
    Output('organizations-info', 'children'),
    Output('timeline-plot', 'figure'),
    Output('choropleth-map', 'figure'),
    Output('pareto-female', 'figure'),
    Output('pareto-male', 'figure'),
    Input('id_select_contact_state', 'value'),
    Input('id_select_animal_age', 'value'),
    Input('id_select_primary_breed', 'value'),
    Input('id_select_dog_name', 'value')
    )
def callback(selected_states, selected_animal_age, selected_primary_breed, selected_dog_name):
    # Normalize all selections
    selected_states = normalize_selection(selected_states, contact_states)
    selected_animal_age = normalize_selection(selected_animal_age, animal_age_list)
    selected_primary_breed = normalize_selection(selected_primary_breed, primary_breeds)
    selected_dog_name = normalize_selection(selected_dog_name, dog_name_list)

    # Filter dataframe based on selections
    df_filtered = ( df
        .filter(pl.col('CONTACT_STATE').is_in(selected_states))
        .filter(pl.col('AGE').is_in(selected_animal_age))
        .filter(pl.col('BREED_PRIMARY').is_in(selected_primary_breed))
        .filter(pl.col('NAME').is_in(selected_dog_name))
    )
    dog_count = df_filtered.height
    top_age_group = get_top_age_group(df_filtered)
    fixed_count = df_filtered.filter(pl.col('FIXED')).height
    fixed_pct = round(100 * fixed_count / dog_count, 1) if dog_count else 0.0
    shots_count = df_filtered.filter(pl.col('SHOTS_CURRENT')).height
    shots_pct = round(100 * shots_count / dog_count, 1) if dog_count else 0.0
    org_count = df_filtered.select(pl.col('ORG_ID')).unique().height
    return (
        f'{dog_count:,}',
        top_age_group,
        f'{fixed_count:,} ({fixed_pct}%)',
        f'{shots_count:,} ({shots_pct}%)',
        f'{org_count:,}',
        get_timeline_plot(df_filtered),
        get_choropleth(df_filtered),
        get_dog_name_pareto(df_filtered, 'Female'),
        get_dog_name_pareto(df_filtered, 'Male')
    )
if __name__ == '__main__':
    app.run(debug=True)
Here is a screenshot of the top portion: