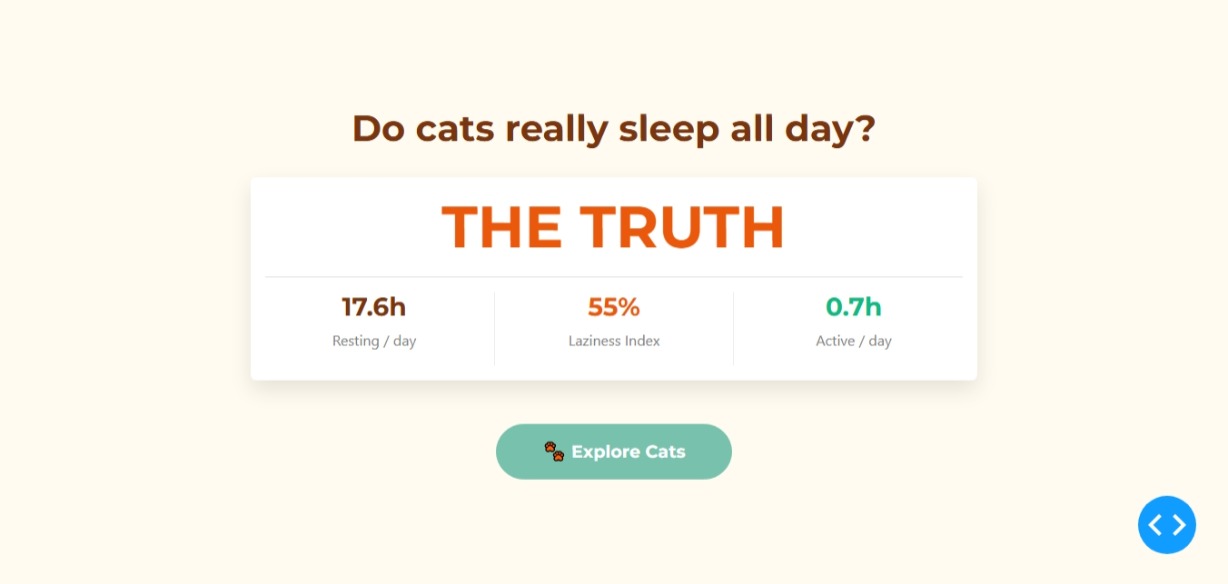
The truth is, according to the Lazy Cats dataset, the answer is yes, or at least, they certainly act like it. More than lazy, the evidence suggests they are stress-free beings (this is just my opinion, as I’m not a cat specialist or owner) who only become active when survival or a craving demands it.
Using this week’s data, I built a simple dashboard and created a key metric I call the Lazy Score.
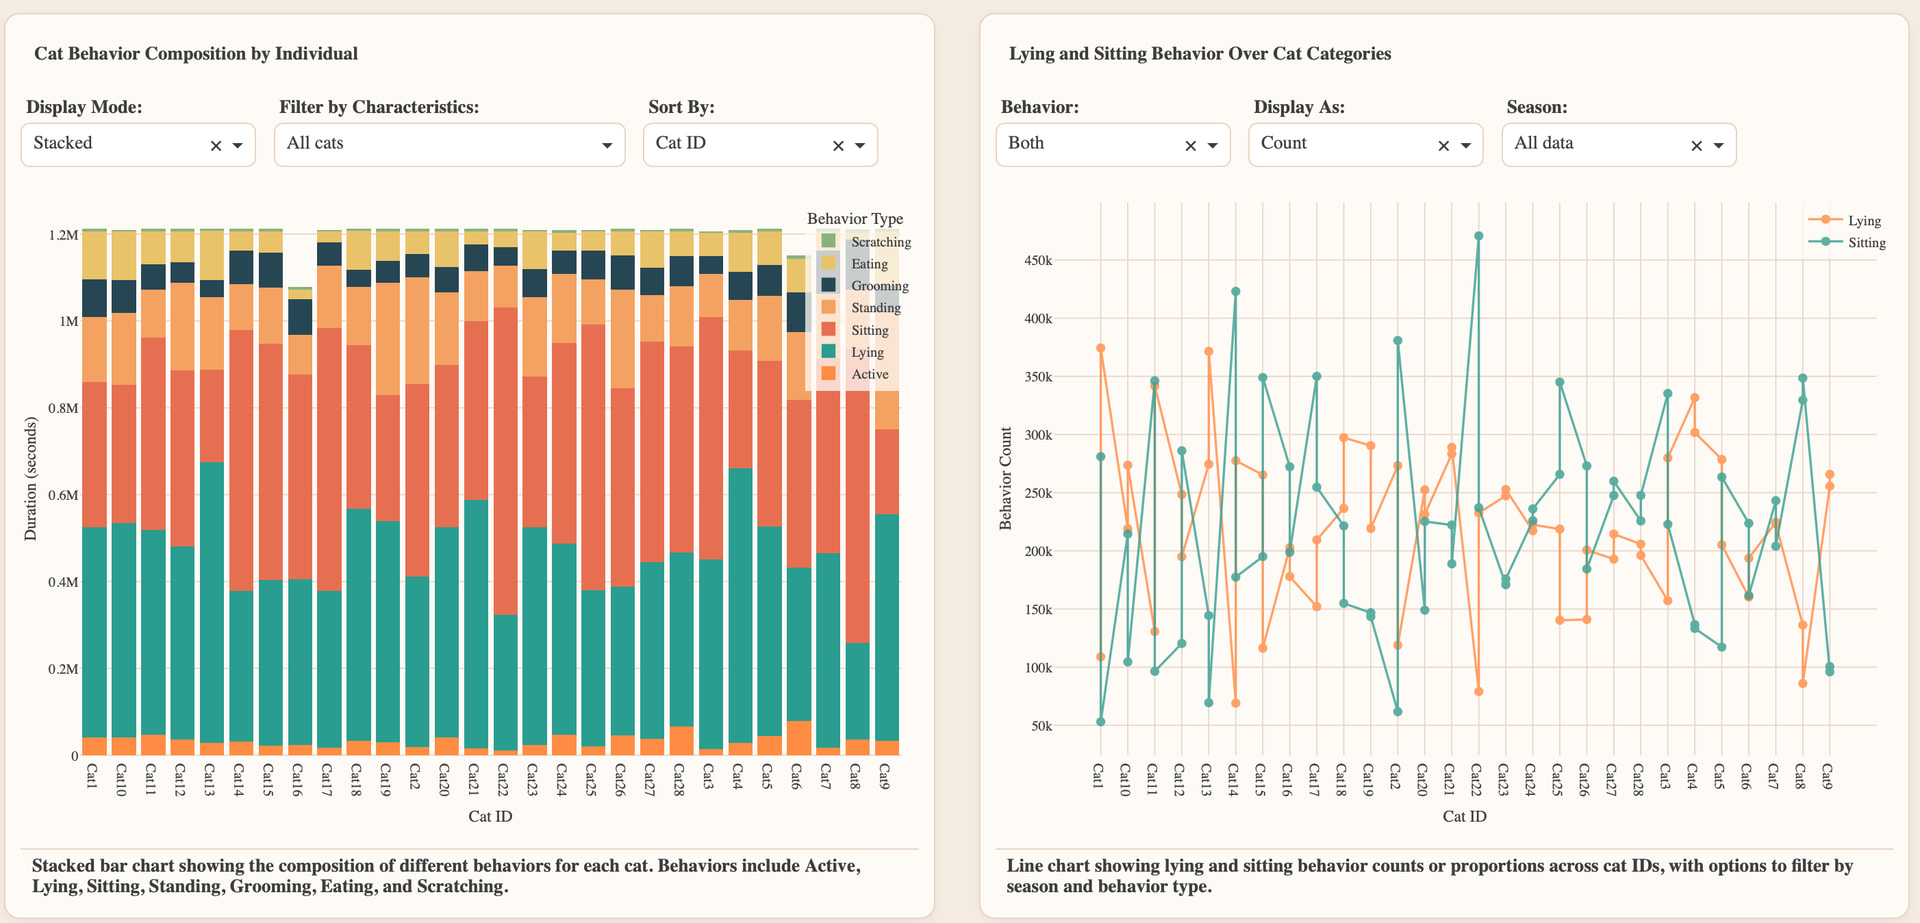
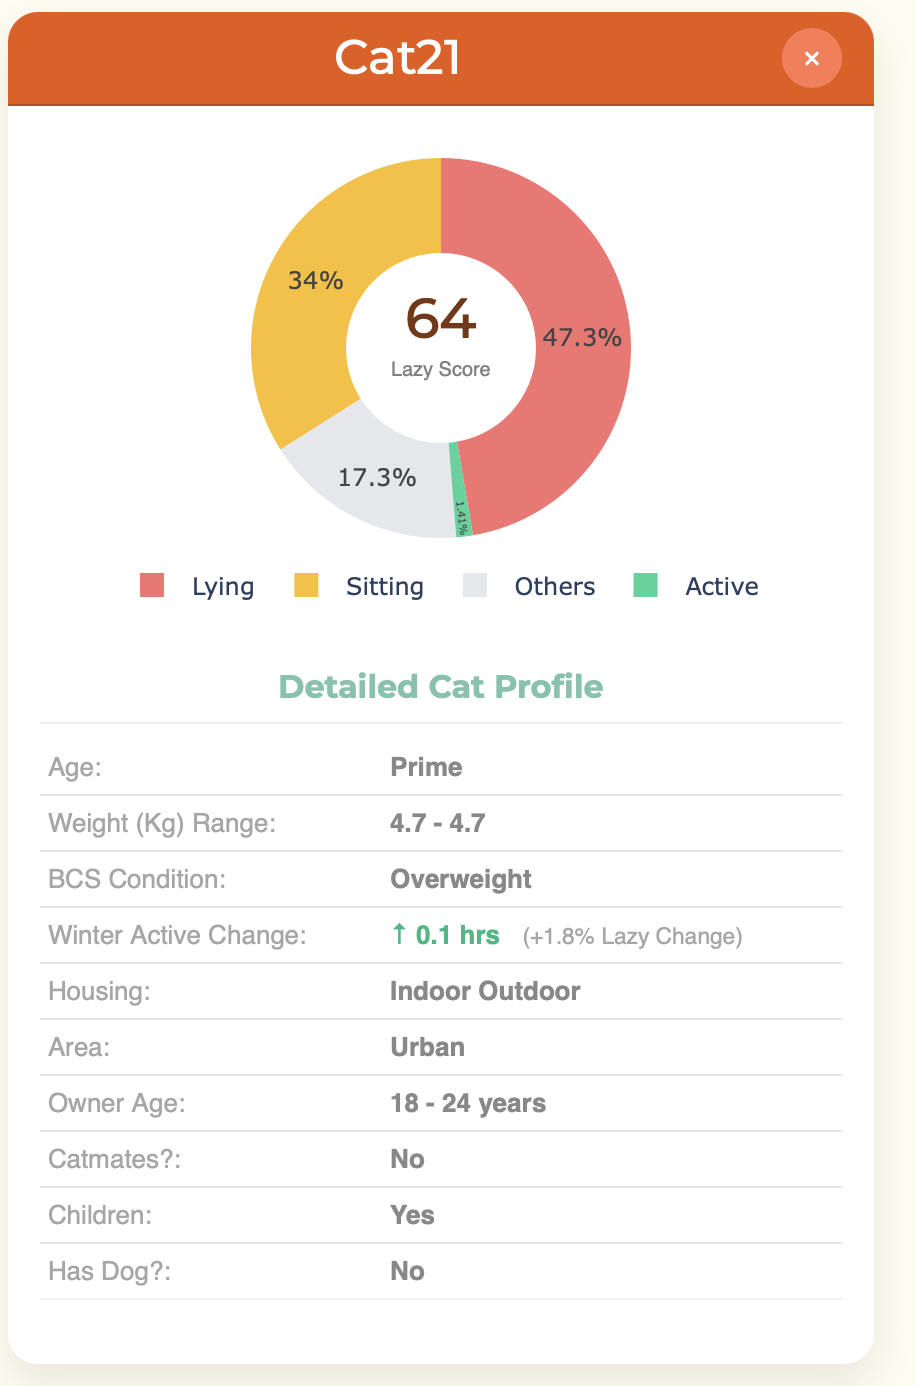
The Lazy Score is a metric that measures a cat’s level of inactivity by giving double the weight to the time spent lying down (the maximum level of laziness) than to the time spent sitting up, comparing this weighted time to their total activity time.
In summary, the Lazy Score tells you, based on my analysis, how much of the cat’s life is spent in “minimal effort” mode.
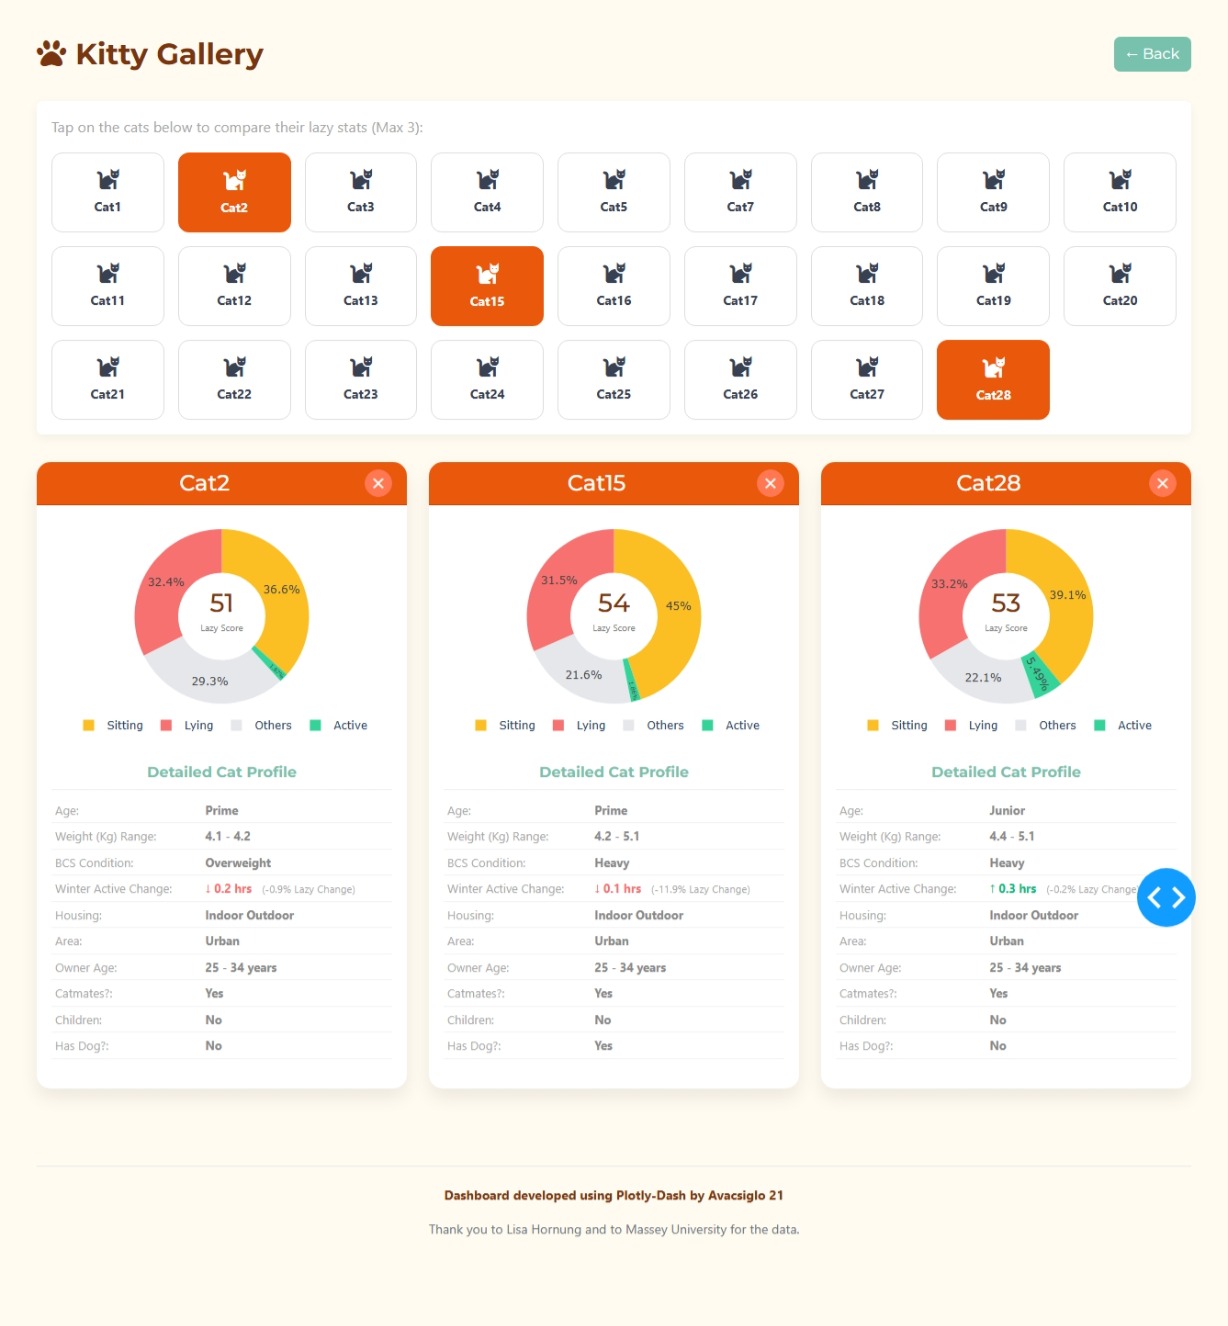
This panel allows me to select up to three cats to view their complete profile. It uses the Lazy Score to measure overall laziness, but I can also see a pie chart that tells me exactly how the cat divides the 24 hours of the day (how much time lying down, sitting up, or active), based on the total of their recorded data. Plus, I can see all their health and environment factors (age, weight, where they live).
The most useful thing is that I calculate with a quick number how much their activity changes in winter versus summer, so I know if they are just sleeping more because of the cold!
The code
import pandas as pd
import plotly.graph_objects as go
from dash import Dash, dcc, html, Input, Output, State, ALL, ctx
import dash_bootstrap_components as dbc
import numpy as np
import re
— 1. DATA LOADING —
try:
df = pd.read_csv(“Weekly_Data.csv”)
except:
# Robust Fallback Data
data = {
‘Cat_id’: [‘Cat1’, ‘Cat1’, ‘Cat2’, ‘Cat2’],
‘Lying’: [100000, 200000, 150000, 250000],
‘Sitting’: [250000, 150000, 200000, 100000],
‘Active’: [20000, 30000, 30000, 40000],
‘Total’: [600000, 600000, 600000, 600000],
‘Housing’: [‘Indoor’, ‘Indoor’, ‘Outdoor’, ‘Outdoor’],
‘Area’: [‘Urban’, ‘Urban’, ‘Rural’, ‘Rural’],
‘Diet’: [‘Dry’, ‘Dry’, ‘Wet’, ‘Wet’],
‘Cat_Age’: [‘2’, ‘2’, ‘5’, ‘5’],
‘Owner_Age’: [‘20-30’, ‘20-30’, ‘30-40’, ‘30-40’],
‘BW’: [4.5, 4.8, 5.2, 5.0],
‘BCS_ord’: [‘Ideal’, ‘Overweight’, ‘Ideal’, ‘Obese’],
‘Dog’: [‘Yes’, ‘Yes’, ‘No’, ‘No’],
‘Children’: [‘No’, ‘No’, ‘Yes’, ‘Yes’],
‘Cat2’: [‘Single’, ‘Single’, ‘Group’, ‘Group’],
‘Season’: [‘Summer’, ‘Winter’, ‘Summer’, ‘Winter’]
}
df = pd.DataFrame(data)
— FIX: ROBUST NUMERIC CONVERSION —
NUMERIC_COLS = [‘Lying’, ‘Sitting’, ‘Active’, ‘Total’, ‘BW’]
for col in NUMERIC_COLS:
df[col] = pd.to_numeric(df[col], errors=‘coerce’)
df = df.dropna(subset=NUMERIC_COLS)
------------------------------------
— 2. DATA PROCESSING —
if ‘Cat2’ not in df.columns:
df[‘Cat2’] = ‘Single’
df[‘Catmates’] = df[‘Cat2’].apply(lambda x: ‘No’ if str(x).lower() == ‘single’ else ‘Yes’)
df[‘Laziness_Index’] = (((df[‘Lying’] * 1.0 + df[‘Sitting’] * 0.5) / df[‘Total’]) * 100).round(1)
df[‘Daily_Rest_Hours’] = ((df[‘Lying’] + df[‘Sitting’]) / df[‘Total’] * 24).round(1)
df[‘Daily_Active_Hours’] = (df[‘Active’] / df[‘Total’] * 24).round(1)
— 3. STYLE CONFIGURATION —
COLORS = {
‘background’: ‘#FFFBF0’,
‘primary’: ‘#EA580C’,
‘secondary’: ‘#78350F’,
‘text’: ‘#374151’
}
FONT_AWESOME = “https://use.fontawesome.com/releases/v5.15.4/css/all.css”
app = Dash(name, external_stylesheets=[dbc.themes.MINTY, dbc.icons.BOOTSTRAP, FONT_AWESOME])
app.title = “Lazy Cats Dashboard”
— LAYOUT —
app.layout = html.Div(style={‘backgroundColor’: COLORS[‘background’], ‘minHeight’: ‘100vh’, ‘fontFamily’: ‘Segoe UI, sans-serif’}, children=[
dcc.Store(id=‘selected-cats’, data=),
# SCREEN 1: THE STORY
html.Div(id='story-screen', style={
    'display': 'flex', 'flexDirection': 'column', 'alignItems': 'center', 'justifyContent': 'center',
    'minHeight': '100vh', 'padding': '40px'
}, children=[
    html.H1("Do cats really sleep all day?", style={'color': COLORS['secondary'], 'fontWeight': 'bold', 'marginBottom': '30px'}),

    dbc.Card(style={'maxWidth': '800px', 'width': '100%', 'boxShadow': '0 10px 25px rgba(0,0,0,0.1)', 'border': 'none'}, children=[
        dbc.CardBody([
            html.H2("THE TRUTH", style={'textAlign': 'center', 'color': COLORS['primary'], 'fontWeight': '900', 'fontSize': '4rem'}),
            html.Hr(),
            dbc.Row([
                dbc.Col([
                    html.H3(f"{df['Daily_Rest_Hours'].mean():.1f}h", style={'color': COLORS['secondary'], 'fontWeight': 'bold'}),
                    html.P("Resting / day", style={'color': 'gray'})
                ], width=4, style={'textAlign': 'center'}),
                dbc.Col([
                    html.H3(f"{df['Laziness_Index'].mean():.0f}%", style={'color': COLORS['primary'], 'fontWeight': 'bold'}),
                    html.P("Laziness Index", style={'color': 'gray'})
                ], width=4, style={'textAlign': 'center', 'borderLeft': '1px solid #eee', 'borderRight': '1px solid #eee'}),
                dbc.Col([
                    html.H3(f"{df['Daily_Active_Hours'].mean():.1f}h", style={'color': '#10B981', 'fontWeight': 'bold'}),
                    html.P("Active / day", style={'color': 'gray'})
                ], width=4, style={'textAlign': 'center'}),
            ])
        ])
    ]),

    dbc.Button("🐾 Explore Cats", id='explore-btn', size="lg", color="primary", className="mt-5",
               style={'borderRadius': '50px', 'padding': '15px 50px', 'fontSize': '1.2rem', 'fontWeight': 'bold'})
]),

# SCREEN 2: THE EXPLORER
html.Div(id='explorer-screen', style={'display': 'none', 'padding': '40px 40px 80px 40px'}, children=[
    dbc.Row([
        dbc.Col(html.H2([html.I(className="fas fa-paw", style={'marginRight': '10px'}), "Kitty Gallery"],
                        style={'color': COLORS['secondary'], 'fontWeight': 'bold'}), width=8),

        dbc.Col(dbc.Button("← Back", id='back-btn', color="primary"), width=4, style={'textAlign': 'right'})
    ], className="mb-4"),

    dbc.Card(style={'border': 'none', 'boxShadow': '0 4px 12px rgba(0,0,0,0.05)', 'marginBottom': '30px'}, children=[
        dbc.CardBody([
            html.P("Tap on the cats below to compare their lazy stats (Max 3):", className="text-muted mb-3"),
            html.Div(id='cat-gallery', style={
                'display': 'grid',
                'gridTemplateColumns': 'repeat(auto-fill, minmax(120px, 1fr))',
                'gap': '15px'
            })
        ])
    ]),

    html.Div(id='comparison-area'),

    html.Footer(style={
        'textAlign': 'center', 'marginTop': '60px', 'color': '#6B7280', 'fontSize': '14px',
        'borderTop': '1px solid #E5E7EB', 'paddingTop': '20px'
    }, children=[
        html.P("Dashboard developed using Plotly-Dash by Avacsiglo 21", style={'fontWeight': 'bold', 'color': COLORS['secondary']}),
        html.P("Thank you to Lisa Hornung and to Massey University for the data.")
    ])
])
])
— CALLBACKS —
@app.callback(
[Output(‘story-screen’, ‘style’), Output(‘explorer-screen’, ‘style’)],
[Input(‘explore-btn’, ‘n_clicks’), Input(‘back-btn’, ‘n_clicks’)],
[State(‘story-screen’, ‘style’), State(‘explorer-screen’, ‘style’)]
)
def toggle_screens(n1, n2, s1, s2):
if (n1 or 0) > (n2 or 0):
return {‘display’: ‘none’}, {‘display’: ‘block’, ‘padding’: ‘40px 40px 80px 40px’}
return {‘display’: ‘flex’, ‘flexDirection’: ‘column’, ‘alignItems’: ‘center’, ‘justifyContent’: ‘center’, ‘minHeight’: ‘100vh’, ‘padding’: ‘40px’}, {‘display’: ‘none’}
@app.callback(
Output(‘cat-gallery’, ‘children’),
[Input(‘selected-cats’, ‘data’)]
)
def generate_gallery(selected_cats):
def natural_sort_key(s):
return [int(text) if text.isdigit() else text.lower() for text in re.split(‘([0-9]+)’, s)]
sorted_cat_ids = sorted(df['Cat_id'].unique(), key=natural_sort_key)
buttons = []

for cat_id in sorted_cat_ids:
    is_selected = cat_id in selected_cats

    btn_style = {
        'backgroundColor': COLORS['primary'] if is_selected else 'white',
        'color': 'white' if is_selected else COLORS['text'],
        'border': f'2px solid {COLORS["primary"]}' if is_selected else '1px solid #ddd',
        'borderRadius': '12px', 'padding': '15px', 'textAlign': 'center', 'cursor': 'pointer', 'transition': '0.3s',
        'display': 'flex', 'flexDirection': 'column', 'alignItems': 'center', 'gap': '8px'
    }

    btn = html.Div(id={'type': 'cat-btn', 'index': cat_id}, n_clicks=0, style=btn_style, children=[
        html.I(className="fas fa-cat", style={'fontSize': '24px'}),
        html.Div(cat_id, style={'fontWeight': 'bold', 'fontSize': '14px'}),
    ])
    buttons.append(btn)
return buttons
@app.callback(
Output(‘selected-cats’, ‘data’),
[Input({‘type’: ‘cat-btn’, ‘index’: ALL}, ‘n_clicks’),
Input({‘type’: ‘delete-btn’, ‘index’: ALL}, ‘n_clicks’)],
[State(‘selected-cats’, ‘data’)]
)
def update_selection(cat_clicks, delete_clicks, selected):
if not ctx.triggered: return selected
trigger_id_str = ctx.triggered[0]['prop_id'].split('.')[0]
trigger_obj = eval(trigger_id_str)
cat_id = trigger_obj['index']
trigger_type = trigger_obj['type']

if trigger_type == 'cat-btn':
    if cat_id in selected: selected.remove(cat_id)
    elif len(selected) < 3: selected.append(cat_id)
elif trigger_type == 'delete-btn':
    if cat_id in selected: selected.remove(cat_id)

return selected
@app.callback(
Output(‘comparison-area’, ‘children’),
[Input(‘selected-cats’, ‘data’)]
)
def update_comparison(selected_cats):
if not selected_cats:
return html.Div(“ Tap on the squad above to reveal their stats.”, style={‘textAlign’: ‘center’, ‘color’: ‘gray’, ‘marginTop’: ‘50px’})
cards = []

for cat_id in selected_cats:
    df_cat = df[df['Cat_id'] == cat_id]

    # 1. ANNUAL AVERAGES & VARIANCE
    try:
        summer_data = df_cat[df_cat['Season'] == 'Summer'].iloc[0]
        winter_data = df_cat[df_cat['Season'] == 'Winter'].iloc[0]

        # --- FIX APPLIED HERE: EXPLICIT FLOAT CONVERSION ---
        # This ensures that active_diff is a float, even if the Pandas Series has odd types.
        summer_active = float(summer_data['Daily_Active_Hours'])
        winter_active = float(winter_data['Daily_Active_Hours'])
        summer_lazy = float(summer_data['Laziness_Index'])
        winter_lazy = float(winter_data['Laziness_Index'])

        active_diff = winter_active - summer_active
        lazy_diff = winter_lazy - summer_lazy
        # --- END FIX ---

        lazy_score_annual = df_cat['Laziness_Index'].mean().round(0)
        bw_min = df_cat['BW'].min()
        bw_max = df_cat['BW'].max()
        bcs_mode_series = df_cat['BCS_ord'].mode()
        avg_bcs_mode = bcs_mode_series.iloc[0] if not bcs_mode_series.empty else 'N/A'

        # VISUAL CUES
        arrow = "↓" if active_diff < 0 else "↑"
        color_active = "#F87171" if active_diff < 0 else "#10B981"

    except IndexError:
        # Fallback if seasonal split fails (e.g., only one row exists)
        lazy_score_annual = df_cat['Laziness_Index'].iloc[0].round(0) if not df_cat.empty else 'N/A'
        bw_min = df_cat['BW'].iloc[0] if not df_cat.empty else 'N/A'
        bw_max = df_cat['BW'].iloc[0] if not df_cat.empty else 'N/A'
        bcs_mode_series = df_cat['BCS_ord'].mode()
        avg_bcs_mode = bcs_mode_series.iloc[0] if not bcs_mode_series.empty else 'N/A'

        active_diff = 'N/A'
        lazy_diff = 'N/A'
        arrow = ''
        color_active = 'gray'
        summer_data = df_cat.iloc[0] if not df_cat.empty else {}

    except ValueError:
        # Fallback if float conversion fails (i.e., data is truly dirty)
        active_diff = 'DATA ERROR'
        lazy_diff = 'DATA ERROR'
        arrow = ''
        color_active = 'gray'
        lazy_score_annual = df_cat['Laziness_Index'].mean().round(0) if not df_cat.empty else 'N/A'
        bcs_mode_series = df_cat['BCS_ord'].mode()
        avg_bcs_mode = bcs_mode_series.iloc[0] if not bcs_mode_series.empty else 'N/A'
        summer_data = df_cat.iloc[0] if not df_cat.empty else {}
        bw_min = df_cat['BW'].min()
        bw_max = df_cat['BW'].max()

    # --- PIE CHART (Now based on Annual Average) ---
    annual_avg_pie = df_cat[['Lying', 'Sitting', 'Active']].mean().sum()

    fig = go.Figure(data=[go.Pie(
        labels=['Lying', 'Sitting', 'Active', 'Others'],
        values=[df_cat['Lying'].mean(), df_cat['Sitting'].mean(), df_cat['Active'].mean(),
                df_cat['Total'].mean() - annual_avg_pie],
        hole=.5,
        marker=dict(colors=['#F87171', '#FBBF24', '#34D399', '#E5E7EB']),
        textinfo='percent',
        textposition='inside'
    )])
    fig.update_layout(
        showlegend=True,
        legend=dict(orientation="h", yanchor="bottom", y=-0.2, xanchor="center", x=0.5),
        margin=dict(t=10, b=50, l=10, r=10),
        height=250,
        paper_bgcolor='rgba(0,0,0,0)'
    )

    score_overlay = html.Div([
        html.H3(f"{lazy_score_annual:.0f}", style={'marginBottom': '-5px', 'color': COLORS['secondary']}),
        html.Small("Lazy Score", style={'color': 'gray', 'fontSize': '10px'})
    ], style={'position': 'absolute', 'top': '40%', 'left': '50%', 'transform': 'translate(-50%, -50%)', 'textAlign': 'center'})

    # --- INFO TABLE (Static + Seasonal Change KPI) ---
    info_table = dbc.Table([
        html.Tbody([
            html.Tr([html.Td("Age:", className="text-muted"), html.Td(f"{summer_data.get('Cat_Age', 'N/A')}", style={'fontWeight': 'bold'})]),
            html.Tr([html.Td("Weight (Kg) Range:", className="text-muted"), html.Td(f"{bw_min:.1f} - {bw_max:.1f}", style={'fontWeight': 'bold'})]),
            html.Tr([html.Td("BCS Condition:", className="text-muted"), html.Td(f"{avg_bcs_mode}", style={'fontWeight': 'bold'})]),

            # SEASONAL VARIANCE KPI
            html.Tr([
                html.Td("Winter Active Change:", className="text-muted"),
                html.Td([
                    # Only show numeric format if active_diff is calculable
                    html.Span(f"{arrow} {abs(active_diff):.1f} hrs" if isinstance(active_diff, float) else str(active_diff), style={'fontWeight': 'bold', 'color': color_active}),
                    html.Small(f" ({lazy_diff:+.1f}% Lazy Change)" if isinstance(lazy_diff, float) else "", className="ms-2 text-muted")
                ])
            ]),

            html.Tr([html.Td("Housing:", className="text-muted"), html.Td(f"{summer_data.get('Housing', 'N/A')}", style={'fontWeight': 'bold'})]),
            html.Tr([html.Td("Area:", className="text-muted"), html.Td(f"{summer_data.get('Area', 'N/A')}", style={'fontWeight': 'bold'})]),
            html.Tr([html.Td("Owner Age:", className="text-muted"), html.Td(f"{summer_data.get('Owner_Age', 'N/A')}", style={'fontWeight': 'bold'})]),
            html.Tr([html.Td("Catmates?:", className="text-muted"), html.Td(f"{summer_data.get('Catmates', 'N/A')}", style={'fontWeight': 'bold'})]),
            html.Tr([html.Td("Children:", className="text-muted"), html.Td(f"{summer_data.get('Children', 'N/A')}", style={'fontWeight': 'bold'})]),
            html.Tr([html.Td("Has Dog?:", className="text-muted"), html.Td("Yes" if summer_data.get('Dog') == 'Yes' else "No", style={'fontWeight': 'bold'})]),
        ])
    ], bordered=False, size="sm", style={'fontSize': '13px'})

    # CARD RESTORED TO LG=4 WIDTH
    card = dbc.Col(dbc.Card(className="h-100", style={'border': 'none', 'boxShadow': '0 10px 20px rgba(0,0,0,0.08)', 'borderRadius': '15px'}, children=[
        dbc.CardHeader([
            dbc.Row([
                dbc.Col(html.H4(cat_id, className="m-0"), width=10, style={'textAlign': 'center', 'paddingLeft': '40px'}),
                dbc.Col(dbc.Button("✕", id={'type': 'delete-btn', 'index': cat_id}, color="danger", size="sm", style={'borderRadius': '50%', 'width': '30px', 'height': '30px', 'padding': '0', 'fontWeight': 'bold'}), width=2, style={'textAlign': 'right'})
            ], align="center")
        ], style={'backgroundColor': COLORS['primary'], 'color': 'white', 'borderRadius': '15px 15px 0 0'}),

        dbc.CardBody([
            html.Div([dcc.Graph(figure=fig, config={'displayModeBar': False}), score_overlay], style={'position': 'relative', 'marginBottom': '15px'}),
            html.H6("Detailed Cat Profile", className="text-primary border-bottom pb-2 text-center", style={'fontWeight': 'bold'}),
            info_table
        ])
    ]), width=12, lg=4, className="mb-4")
    cards.append(card)

return dbc.Row(cards)
server = app.server